Native Reference Guide
This guide is a companion to the Building a Native Executable, Using SSL With Native Images, and Writing Native Applications, guides. It explores advanced topics that help users diagnose issues, increase the reliability and improve the runtime performance of native executables. These are the high level sections to be found in this guide:
Native Memory Management
Memory management for Quarkus native executables is enabled by GraalVM’s SubstrateVM runtime system.
For detailed explanations about the memory management component in GraalVM, see the GraalVM Memory Management guide.
This guide complements the information available in the GraalVM website with further observations particularly relevant to Quarkus applications.
Garbage Collectors
The garbage collectors available for Quarkus users are currently Serial GC and Epsilon GC.
Serial GC
Serial GC, the default option in GraalVM and Quarkus, is a single-threaded non-concurrent GC, just like HotSpot’s Serial GC. The implementation in GraalVM however is different from the HotSpot one, and there can be significant differences in the runtime behavior.
One of the key differences between HotSpot’s Serial GC and GraalVM’s Serial GC is the way they perform full GC cycles. In HotSpot the algorithm used is mark-sweep-compact whereas in GraalVM it is mark-copy. Both need to traverse all live objects, but in mark-copy this traversal is also used to copy live objects to a secondary space or semi-space. As objects are copied from one semi-space to another they’re also compacted. In mark-sweep-compact, the compacting requires a second pass on the live objects. This makes full GCs in mark-copy more time efficient (in terms of time spent in each GC cycle) than mark-sweep-compact. The tradeoff mark-copy makes in order to make individual full GC cycles shorter is space. The use of semi-spaces means that for an application to maintain the same GC performance that mark-sweep achieves (in terms of allocated MB per second), it requires double the amount of memory.
GC Collection Policy
GraalVM’s Serial GC implementation offers a choice between two different collection policies, the default is called "adaptive" and the alternative is called "space/time".
The “adaptive” collection policy is based on HotSpot’s ParallelGC adaptive size policy. The main difference with HotSpot is GraalVM’s focus on memory footprint. This means that GraalVM’s adaptive GC policy tries to aggressively trigger GCs in order to keep memory consumption down.
Up to version 2.13, Quarkus used the “space/time” GC collection policy by default, but starting with version 2.14, it switched to using the “adaptive” policy instead. The reason why Quarkus initially chose to use "space/time" is because at that time it had considerable performance improvements over "adaptive". Recent performance experiments, however, indicate that the "space/time" policy can result in worse out-of-the-box experience compared to the "adaptive" policy, while at the same time the benefits it used to offer have diminished considerably after improvements made to the "adaptive" policy. As a result, the "adaptive" policy appears to be the best option for most, if not all, Quarkus applications. Full details on this switch can be read in this issue.
It is still possible to change the GC collection policy using GraalVM’s -H:InitialCollectionPolicy flag.
Switching to the "space/time" policy can be done by passing the following via command line:
-Dquarkus.native.additional-build-args=-H:InitialCollectionPolicy=com.oracle.svm.core.genscavenge.CollectionPolicy\$BySpaceAndTimeOr adding this to the application.properties file:
quarkus.native.additional-build-args=-H:InitialCollectionPolicy=com.oracle.svm.core.genscavenge.CollectionPolicy$BySpaceAndTime|
Escaping the |
Epsilon GC
Epsilon GC is a no-op garbage collector which does not do any memory reclamation. From a Quarkus perspective, some of the most relevant use cases for this garbage collector are extremely short-lived jobs, e.g. serverless functions. To build Quarkus native with epsilon GC, pass the following argument at build time:
-Dquarkus.native.additional-build-args=--gc=epsilonMemory Management Options
For information about options to control maximum heap size, young space, and other typical use cases found in the JVM, see the GraalVM Memory Management guide. Setting the maximum heap size, either as a percentage or an explicit value, is generally recommended.
GC Logging
Multiple options exist to print information about garbage collection cycles, depending on the level of detail required.
The minimum detail is provided -XX:+PrintGC, which prints a message for each GC cycle that occurs:
$ quarkus-project-0.1-SNAPSHOT-runner -XX:+PrintGC -Xmx64m
...
[Incremental GC (CollectOnAllocation) 20480K->11264K, 0.0003223 secs]
[Full GC (CollectOnAllocation) 19456K->5120K, 0.0031067 secs]
When you combine this option with -XX:+VerboseGC you still get a message per GC cycle,
but it contains extra information.
Also, adding this option shows the sizing decisions made by the GC algorithm at startup:
$ quarkus-project-0.1-SNAPSHOT-runner -XX:+PrintGC -XX:+VerboseGC -Xmx64m
[Heap policy parameters:
YoungGenerationSize: 25165824
MaximumHeapSize: 67108864
MinimumHeapSize: 33554432
AlignedChunkSize: 1048576
LargeArrayThreshold: 131072]
...
[[5378479783321 GC: before  epoch: 8  cause: CollectOnAllocation]
[Incremental GC (CollectOnAllocation) 16384K->9216K, 0.0003847 secs]
[5378480179046 GC: after   epoch: 8  cause: CollectOnAllocation  policy: adaptive  type: incremental
collection time: 384755 nanoSeconds]]
[[5379294042918 GC: before  epoch: 9  cause: CollectOnAllocation]
[Full GC (CollectOnAllocation) 17408K->5120K, 0.0030556 secs]
[5379297109195 GC: after   epoch: 9  cause: CollectOnAllocation  policy: adaptive  type: complete
collection time: 3055697 nanoSeconds]]
Beyond these two options, -XX:+PrintHeapShape and -XX:+TraceHeapChunks provide even lower level details about memory chunks on top of which the different memory regions are constructed.
The most up-to-date information on GC logging flags can be obtained by printing the list of flags that can be passed to native executables:
$ quarkus-project-0.1-SNAPSHOT-runner -XX:PrintFlags=
...
  -XX:±PrintGC                                 Print summary GC information after each collection. Default: - (disabled).
  -XX:±PrintGCSummary                          Print summary GC information after application main method returns. Default: - (disabled).
  -XX:±PrintGCTimeStamps                       Print a time stamp at each collection, if +PrintGC or +VerboseGC. Default: - (disabled).
  -XX:±PrintGCTimes                            Print the time for each of the phases of each collection, if +VerboseGC. Default: - (disabled).
  -XX:±PrintHeapShape                          Print the shape of the heap before and after each collection, if +VerboseGC. Default: - (disabled).
...
  -XX:±TraceHeapChunks                         Trace heap chunks during collections, if +VerboseGC and +PrintHeapShape. Default: - (disabled).
  -XX:±VerboseGC                               Print more information about the heap before and after each collection. Default: - (disabled).
Resident Set Size (RSS)
As described in the Measuring Performance guide, the footprint of Quarkus applications is measured using the resident set size (RSS). This is also applicable to native applications, but the runtime engine that manages the footprint in this case is built in the native executable itself rather than the JVM.
The reporting techniques specified in the Measuring Performance guide are applicable to native applications too, but what causes the RSS to be higher or lower is specific to how the generated native executables work.
When the RSS is higher in one native version of the application versus another, the following checks should be carried out first:
-
Check the native build time reports and see if there are big discrepancies in the number of used packages, used classes or used methods. A bigger universe will result in bigger memory footprint.
-
Check the size of the binary for differences. Using
readelfyou can observe the size of different sections and compare them. The.textsection where code lives, and the.svm_heapsection where heap produced at build time lives, are particularly interesting. -
Generate heap dumps and inspect them with tools such as VisualVM or Eclipse MAT.
Often profiling, instrumenting or tracing applications is the best way to figure out how things work.
In the case of RSS and native applications,
the techniques that Brendan Gregg explains in the
"Memory Leak (and Growth) Flame Graphs" guide are particularly useful.
This section will apply the information in that article to show how to use perf and
bcc/eBPF
to understand what causes Quarkus native executables to consume memory on startup.
Perf
perf works in older Linux systems, whereas eBPF requires a newer Linux kernel.
The overhead of perf is higher than eBPF,
but it can understand stack traces generated with DWARF debug symbols, which eBPF can’t.
In the context of GraalVM, DWARF stack traces contain more detail and are easier to understand than those generated with frame pointers. As first step, build a Quarkus native executable with debug info enabled and a couple of extra flags. One flag to disable optimizations, and another to avoid inlined methods being omitted from the stack traces. These two flags have been added to obtain stack traces that contain as much information as possible.
$ mvn package -DskipTests -Dnative \
  -Dquarkus.native.debug.enabled \
-Dquarkus.native.additional-build-args=-O0,-H:-OmitInlinedMethodDebugLineInfo|
Disabling optimizations makes it easier to learn how to use |
Let’s measure how much RSS a Quarkus native executable takes on startup on this particular environment:
$ ps -o pid,rss,command -p $(pidof code-with-quarkus-1.0.0-SNAPSHOT-runner)
      PID   RSS COMMAND
     1915 35472 ./target/code-with-quarkus-1.0.0-SNAPSHOT-runner -Xmx128m
How come this Quarkus native executable consumes ~35MB RSS on startup?
To get an understanding of this number, this section will use perf to trace calls to syscalls:sys_enter_mmap.
Assuming the default GraalVM Serial Garbage Collector is in use, this system call is particularly interesting for native executables generated by GraalVM’s native-image because of how it allocates heap.
In native executables generated by GraalVM’s native-image, the heap is allocated using either aligned or unaligned heap chunks.
All non-array objects get allocated in thread local aligned chunks.
Each of these are 1MB in size by default.
For arrays, if they are bigger than 1/8 of the aligned chunk size,
they will be allocated in unaligned heap chunks which have a size dependant on the object itself.
The very first time a thread allocates an object or small array,
it will request an aligned heap chunk that it will use exclusively until it has run out of space in that chunk,
in which case it will request another aligned heap chunk.
So by tracing these system calls,
the code paths that end up requesting new aligned or unaligned heap chunks will be recorded.
Next, run the Quarkus native executable through perf record tracing the mmap system call:
$ sudo perf record -e syscalls:sys_enter_mmap --call-graph dwarf -a -- target/code-with-quarkus-1.0.0-SNAPSHOT-runner -Xmx128m|
The size of the aligned heap chunks can be changed during native build time.
A custom value (in number of bytes) can be passed via the |
Once the startup completes, stop the process and generate the stacks:
$ perf script > out.stacksAs a final step, generate a flamegraph with the generated stacks:
$ export FG_HOME=...
$ ${FG_HOME}/stackcollapse-perf.pl < out.stacks | ${FG_HOME}/flamegraph.pl \
    --color=mem --title="mmap Flame Graph" --countname="calls" > out.svg
The flamegraph should look similar to this:

There are several things of interest to notice there:
First, the stack traces that contain method calls to com.oracle.svm.core.genscavenge.ThreadLocalAllocation are related to aligned or unaligned heap chunk allocations explained above.
As noted earlier,
for the majority of allocations these chunks will be 1MB by default,
so they’re interesting because each allocated chunk has a considerable effect on the RSS consumption.
Second, of the thread allocation stacks,
the ones under start_thread are particularly revealing.
In this environment, taking into account the -Xmx value passed in,
Quarkus creates 12 event loop threads.
Aside from those, there are 6 extra threads.
The names of all those 18 threads exceed 16 characters.
This can be observed via the ps command:
$ ps -e -T | grep $(pidof code-with-quarkus-1.0.0-SNAPSHOT-runner)
   2320    2320 pts/0    00:00:00 code-with-quark
   2320    2321 pts/0    00:00:00 ference Handler
   2320    2322 pts/0    00:00:00 gnal Dispatcher
   2320    2324 pts/0    00:00:00 ecutor-thread-0
   2320    2325 pts/0    00:00:00 -thread-checker
   2320    2326 pts/0    00:00:00 ntloop-thread-0
   2320    2327 pts/0    00:00:00 ntloop-thread-1
   2320    2328 pts/0    00:00:00 ntloop-thread-2
   2320    2329 pts/0    00:00:00 ntloop-thread-3
   2320    2330 pts/0    00:00:00 ntloop-thread-4
   2320    2331 pts/0    00:00:00 ntloop-thread-5
   2320    2332 pts/0    00:00:00 ntloop-thread-6
   2320    2333 pts/0    00:00:00 ntloop-thread-7
   2320    2334 pts/0    00:00:00 ntloop-thread-8
   2320    2335 pts/0    00:00:00 ntloop-thread-9
   2320    2336 pts/0    00:00:00 tloop-thread-10
   2320    2337 pts/0    00:00:00 tloop-thread-11
   2320    2338 pts/0    00:00:00 ceptor-thread-0
The very first allocation that all these threads do is taking the thread name and trimming it so that it can fall within the character limit enforced by kernels.
For each of those allocations,
there are 2 mmap calls,
one to reserve the memory and the other to commit it.
When recording syscalls:sys_enter_mmap system call,
the perf implementation tracks calls to GI_mmap64.
But this glibc GI_mmap64 implementation makes another call into GI_mmap64:
(gdb) break __GI___mmap64
(gdb) set scheduler-locking step
...
Thread 2 "code-with-quark" hit Breakpoint 1, __GI___mmap64 (offset=0, fd=-1, flags=16418, prot=0, len=2097152, addr=0x0) at ../sysdeps/unix/sysv/linux/mmap64.c:58
58	  return (void *) MMAP_CALL (mmap, addr, len, prot, flags, fd, offset);
(gdb) bt
#0  __GI___mmap64 (offset=0, fd=-1, flags=16418, prot=0, len=2097152, addr=0x0) at ../sysdeps/unix/sysv/linux/mmap64.c:58
#1  __GI___mmap64 (addr=0x0, len=2097152, prot=0, flags=16418, fd=-1, offset=0) at ../sysdeps/unix/sysv/linux/mmap64.c:46
#2  0x00000000004f4033 in com.oracle.svm.core.posix.headers.Mman$NoTransitions::mmap (__0=<optimized out>, __1=<optimized out>, __2=<optimized out>, __3=<optimized out>, __4=<optimized out>, __5=<optimized out>)
#3  0x00000000004f194e in com.oracle.svm.core.posix.PosixVirtualMemoryProvider::reserve (this=0x7ffff7691220, nbytes=0x100000, alignment=0x100000, executable=false) at com/oracle/svm/core/posix/PosixVirtualMemoryProvider.java:126
#4  0x00000000004ef3b3 in com.oracle.svm.core.os.AbstractCommittedMemoryProvider::allocate (this=0x7ffff7658cb0, size=0x100000, alignment=0x100000, executable=false) at com/oracle/svm/core/os/AbstractCommittedMemoryProvider.java:124
#5  0x0000000000482f40 in com.oracle.svm.core.os.AbstractCommittedMemoryProvider::allocateAlignedChunk (this=0x7ffff7658cb0, nbytes=0x100000, alignment=0x100000) at com/oracle/svm/core/os/AbstractCommittedMemoryProvider.java:107
#6  com.oracle.svm.core.genscavenge.HeapChunkProvider::produceAlignedChunk (this=0x7ffff7444398) at com/oracle/svm/core/genscavenge/HeapChunkProvider.java:112
#7  0x0000000000489485 in com.oracle.svm.core.genscavenge.ThreadLocalAllocation::slowPathNewArrayLikeObject0 (hub=0x7ffff6ff6110, length=15, size=0x20, podReferenceMap=0x7ffff6700000) at com/oracle/svm/core/genscavenge/ThreadLocalAllocation.java:306
#8  0x0000000000489165 in com.oracle.svm.core.genscavenge.ThreadLocalAllocation::slowPathNewArrayLikeObject (objectHeader=0x8f6110 <io.smallrye.common.expression.ExpressionNode::toString+160>, length=15, podReferenceMap=0x7ffff6700000) at com/oracle/svm/core/genscavenge/ThreadLocalAllocation.java:279
#9  0x0000000000489066 in com.oracle.svm.core.genscavenge.ThreadLocalAllocation::slowPathNewArray (objectHeader=0x8f6110 <io.smallrye.common.expression.ExpressionNode::toString+160>, length=15) at com/oracle/svm/core/genscavenge/ThreadLocalAllocation.java:242
#10 0x0000000000d202a1 in java.util.Arrays::copyOfRange (original=0x7ffff6a33410, from=2, to=17) at java/util/Arrays.java:3819
#11 0x0000000000acf8e6 in java.lang.StringLatin1::newString (val=0x7ffff6a33410, index=2, len=15) at java/lang/StringLatin1.java:769
#12 0x0000000000acac59 in java.lang.String::substring (this=0x7ffff6dc0d48, beginIndex=2, endIndex=17) at java/lang/String.java:2712
#13 0x0000000000acaba2 in java.lang.String::substring (this=0x7ffff6dc0d48, beginIndex=2) at java/lang/String.java:2680
#14 0x00000000004f96cd in com.oracle.svm.core.posix.thread.PosixPlatformThreads::setNativeName (this=0x7ffff7658d10, thread=0x7ffff723fb30, name=0x7ffff6dc0d48) at com/oracle/svm/core/posix/thread/PosixPlatformThreads.java:163
#15 0x00000000004f9285 in com.oracle.svm.core.posix.thread.PosixPlatformThreads::beforeThreadRun (this=0x7ffff7658d10, thread=0x7ffff723fb30) at com/oracle/svm/core/posix/thread/PosixPlatformThreads.java:212
#16 0x00000000005237a2 in com.oracle.svm.core.thread.PlatformThreads::threadStartRoutine (threadHandle=0x1) at com/oracle/svm/core/thread/PlatformThreads.java:760
#17 0x00000000004f9627 in com.oracle.svm.core.posix.thread.PosixPlatformThreads::pthreadStartRoutine (data=0x2a06e20) at com/oracle/svm/core/posix/thread/PosixPlatformThreads.java:203
#18 0x0000000000462ab0 in com.oracle.svm.core.code.IsolateEnterStub::PosixPlatformThreads_pthreadStartRoutine_38d96cbc1a188a6051c29be1299afe681d67942e (__0=<optimized out>) at com/oracle/svm/core/code/IsolateEnterStub.java:1
#19 0x00007ffff7e4714d in start_thread (arg=<optimized out>) at pthread_create.c:442
#20 0x00007ffff7ec8950 in clone3 () at ../sysdeps/unix/sysv/linux/x86_64/clone3.S:81|
Setting |
This is how the above flamegraph shows a total of 72 calls to GI_mmap64 for the thread name abbreviation stack trace,
given that Quarkus native executable runs 18 threads.
A third, and final observation,
is that if you capture the syscalls:sys_enter_munmmap event,
you might observe that some allocations also result in calls to munmap.
When calculating the size to reserve,
the requested size to allocate can be rounded up to the page size.
The maintain alignment,
1MB in case of aligned chunks or 1 byte for unaligned chunks,
some of the reserved memory might be unreserved.
That is where these munmap calls would come from.
|
Just by looking at the flamegraph and counting the number of |
bcc/eBPF
A version of bcc/ eBPF that can do stack traces is only available from Linux kernel 4.8 onwards. It can do in-kernel summaries, which makes it more efficient and has lower overhead. Unfortunately it doesn’t understand DWARF debug symbols, so the information obtained might be harder to read and contain less detail.
bcc/eBPF is very extensible so it’s easier to tailor make scripts to track specific metrics.
The bcc project contains a stackcount program that can be used to count stack traces in similar way to what perf did in the previous section.
But in some cases, it might be more useful to have other metrics other than number of calls to a system call.
malloc is one such example.
The number of malloc calls is not so important,
but rather the size of the allocations.
So rather than having a flamegraph showing sample counts,
a flamegraph can be generated that shows bytes allocated.
Aside from mmap,
malloc system calls are also present in native executables generated by GraalVM.
Let’s put bcc/eBPF in action to generate a flamegraph of bytes allocated using malloc.
To do this, first re-generate a Quarkus native executable removing debug info, which bcc/eBPF does not understand, and instead use frame pointer with local symbols to get the stack traces:
$ mvn package -DskipTests -Dnative \
  -Dquarkus.native.additional-build-args=-H:-DeleteLocalSymbols,-H:+PreserveFramePointer
The mallocstacks.py
bcc/eBPF script will be used to capture the malloc stacktraces with their allocated size.
This script, and other typical bcc/eBPF scripts (e.g. stackcount), need to be given a process ID (PID).
This makes a bit tricky when you want to trace startup,
but you can use gdb
(even if you haven’t enabled debug info)
to get around this obstacle because it allows you to stop the application at the first instruction.
Let’s start by running the native executable via gdb:
$ gdb --args ./target/code-with-quarkus-1.0.0-SNAPSHOT-runner -Xmx128m
...
(No debugging symbols found in ./target/code-with-quarkus-1.0.0-SNAPSHOT-runner)
starti is a gdb command that sets a temporary breakpoint at the very first instruction of the program’s execution.
(gdb) starti
Starting program: <..>/code-with-quarkus/target/code-with-quarkus-1.0.0-SNAPSHOT-runner -Xmx128m
Program stopped.
0x00007ffff7fe4790 in _start () from /lib64/ld-linux-x86-64.so.2
Next invoke the bcc/eBPF script giving it the PID of the Quarkus process,
so that it can track the malloc calls,
capture stack traces and dump them to a file for post-processing:
$ sudo ./mallocstacks.py -p $(pidof code-with-quarkus-1.0.0-SNAPSHOT-runner) -f > out.stacksThen go back to the gdb shell and instruct it to continue the startup procedure after hitting the first instruction:
(gdb) continue
Continuing.
[Thread debugging using libthread_db enabled]
Using host libthread_db library "/lib64/libthread_db.so.1".
[New Thread 0x7ffff65ff6c0 (LWP 3342)]
...
[New Thread 0x7fffc6ffd6c0 (LWP 3359)]
__  ____  __  _____   ___  __ ____  ______
 --/ __ \/ / / / _ | / _ \/ //_/ / / / __/
 -/ /_/ / /_/ / __ |/ , _/ ,< / /_/ /\ \
--\___\_\____/_/ |_/_/|_/_/|_|\____/___/
2023-02-09 18:02:32,794 INFO  [io.quarkus] (main) code-with-quarkus 1.0.0-SNAPSHOT native (powered by Quarkus 2.16.1.Final) started in 0.011s. Listening on: http://0.0.0.0:8080
2023-02-09 18:02:32,794 INFO  [io.quarkus] (main) Profile prod activated.
2023-02-09 18:02:32,794 INFO  [io.quarkus] (main) Installed features: [cdi, rest, smallrye-context-propagation, vertx]
Once the startup has complete,
press Ctrl-C on the stackcount shell.
Then process the stacks file as a flamegraph. Note that the stacks generated by this script are already collapsed, so the flamegraph can be generated just like this:
$ cat out.stacks | ${FG_HOME}/flamegraph.pl --color=mem --title="malloc bytes Flame Graph" --countname="bytes" > out.svgThe flamegraph produced should look something like this:

This shows that most of the memory requested using malloc comes from epoll in Java NIO,
but the overall amount allocated via malloc is barely 268KB.
This amount of 274,269 bytes can be observed by hovering on top of all at the bottom of flamegraph
(you might need to ask the browser to open the flamegraph in a different tab or window to observe this).
This is very small compared with the amount allocated for the heap with mmap.
Finally, just a brief mention about other bcc/eBPF commands, and how to transform them into flamegraphs.
$ sudo /usr/share/bcc/tools/stackcount -P -p $(pidof code-with-quarkus-1.0.0-SNAPSHOT-runner) \
  -U "t:syscalls:sys_enter_m*" # count stacks for mmap and munmap

$ sudo /usr/share/bcc/tools/stackcount -P -p $(pidof code-with-quarkus-1.0.0-SNAPSHOT-runner) \
  -U "c:*alloc" # count stacks for malloc, calloc and realloc

$ sudo /usr/share/bcc/tools/stackcount -P -p $(pidof code-with-quarkus-1.0.0-SNAPSHOT-runner) \
  -U "c:free" # count stacks for free

$ sudo /usr/share/bcc/tools/stackcount -P -p $(pidof code-with-quarkus-1.0.0-SNAPSHOT-runner) \
  -U "t:exceptions:page_fault_*" # count stacks for page faults
Stacks produced by stackcount need to be collapsed before they can be transformed into flamegraphs.
For example:
${FG_HOME}/stackcollapse.pl < out.stacks | ${FG_HOME}/flamegraph.pl \
  --color=mem --title="mmap munmap Flame Graph" --countname="calls" > out.svg
Native Image Tracing Agent Integration
Quarkus users that want to integrate new libraries/components into native image process (e.g. smbj), or want to use JDK APIs that require extensive native image configuration to work (e.g. graphical user interfaces), face a considerable challenge coming up with the native image configuration to make their use cases work. These users can tweak their applications to run in JVM mode with the native image agent in order to auto-generate native image configuration that will help them get a head start getting applications to work as native executables.
The native image tracing agent is a JVM tool interface (JVMTI) agent available within both GraalVM and Mandrel that tracks all usages of dynamic features such as reflection, JNI, dynamic proxies, access classpath resources…etc, during an application’s regular JVM execution. When the JVM stops, it dumps the information on the dynamic features used during the run onto a collection of native image configuration files that can be used in subsequent native image builds.
Using the agent and applying the generated data can be difficult for Quarkus users. First, the agent can be cumbersome because it requires the JVM arguments to be modified, and the generated configuration needs to be placed in a specific location such that the subsequent native image builds picks them up. Secondly, the native image configuration produced contains a lot of superfluous configuration that the Quarkus integration takes care of.
Native image tracing agent integration is included in Quarkus to make the agent easier to consume. In this section you will learn about the integration and how to apply it to your Quarkus application.
|
The integration is currently only available for Maven applications. Gradle integration will follow up. |
Integration Testing with the Tracing Agent
Quarkus users can now run JVM mode integration tests on Quarkus Maven applications transparently with the native image tracing agent. To do this make sure a container runtime is available, because JVM mode integration tests will run using the JVM within the default Mandrel builder container image. This image contains the agent libraries required to produce native image configuration, hence avoiding the need for a local Mandrel or GraalVM installation.
|
It is highly recommended to align the Mandrel version used in integration testing with the Mandrel version used to build native executables. Doing in-container native builds with the default Mandrel builder image, is the safest way to keep both versions aligned. |
Additionally make sure that the quarkus:native-image-agent goal is executed:
it is part of the default lifecycle when using the quarkus packaging.
With a container runtime running,
invoke Maven’s verify goal with -DskipITs=false -Dquarkus.test.integration-test-profile=test-with-native-agent to run the JVM mode integration tests and
generate the native image configuration.
For example:
$ ./mvnw verify -DskipITs=false -Dquarkus.test.integration-test-profile=test-with-native-agent
...
[INFO] --- failsafe:3.5.4:integration-test (default) @ new-project ---
...
[INFO] -------------------------------------------------------
[INFO]  T E S T S
[INFO] -------------------------------------------------------
[INFO] Running org.acme.GreetingResourceIT
2024-05-14 16:29:53,941 INFO  [io.qua.tes.com.DefaultDockerContainerLauncher] (main) Executing "podman run --name quarkus-integration-test-PodgW -i --rm --user 501:20 -p 8081:8081 -p 8444:8444 --entrypoint java -v /tmp/new-project/target:/project --env QUARKUS_LOG_CATEGORY__IO_QUARKUS__LEVEL=INFO --env QUARKUS_HTTP_PORT=8081 --env QUARKUS_HTTP_SSL_PORT=8444 --env TEST_URL=http://localhost:8081 --env QUARKUS_PROFILE=test-with-native-agent --env QUARKUS_TEST_INTEGRATION_TEST_PROFILE=test-with-native-agent quay.io/quarkus/ubi9-quarkus-mandrel-builder-image:jdk-21 -agentlib:native-image-agent=access-filter-file=quarkus-access-filter.json,caller-filter-file=quarkus-caller-filter.json,config-output-dir=native-image-agent-base-config, -jar quarkus-app/quarkus-run.jar"
...
[INFO]
[INFO] --- quarkus:3.37.4:native-image-agent (default) @ new-project ---
[INFO] Discovered native image agent generated files in /tmp/new-project/target/native-image-agent-final-config
[INFO]
...
When the Maven invocation completes,
you can inspect the generated configuration in the target/native-image-agent-final-config folder:
$ cat ./target/native-image-agent-final-config/reflect-config.json
[
...
{
  "name":"org.acme.Alice",
  "methods":[{"name":"<init>","parameterTypes":[] }, {"name":"sayMyName","parameterTypes":[] }]
},
{
  "name":"org.acme.Bob"
},
...
]
Informative By Default
By default the generated native image configuration files are not used by subsequent native image building processes. This precaution is taken to avoid situations where seemingly unrelated actions have unintended consequences on the native executable produced, e.g. disabling randomly failing tests.
Quarkus users are free to copy the files from the folder reported in the build,
store them under source control and evolve as needed.
Ideally these files should be stored under the src/main/resources/META-INF/native-image/<group-id>/<artifact-id>` folder,
in which case the native image process will automatically pick them up.
|
If managing native image agent configuration files manually, it is highly recommended to regenerate them each time a Mandrel version update occurs, because the configuration necessary to make the application work might have varied due to internal Mandrel changes. |
It is possible to instruct Quarkus to optionally apply the generated native image configuration files into subsequent native image processes, by setting the -Dquarkus.native.agent-configuration-apply` property. This can be useful to verify that the native integration tests work as expected, assuming that the JVM unit tests have generated the correct native image configuration. The typical workflow here would be to first run the integration tests with the native image agent as shown in the previous section:
$ ./mvnw verify -DskipITs=false -Dquarkus.test.integration-test-profile=test-with-native-agent
...
[INFO] --- quarkus:3.37.4:native-image-agent (default) @ new-project ---
[INFO] Discovered native image agent generated files in /tmp/new-project/target/native-image-agent-final-config
And then request a native build passing in the configuration apply flag. A message during the native build process will indicate that the native image agent generated configuration files are being applied:
$ ./mvnw verify -Dnative -Dquarkus.native.agent-configuration-apply
...
[INFO] --- quarkus:3.37.4:build (default) @ new-project ---
[INFO] [io.quarkus.deployment.pkg.steps.JarResultBuildStep] Building native image source jar: /tmp/new-project/target/new-project-1.0.0-SNAPSHOT-native-image-source-jar/new-project-1.0.0-SNAPSHOT-runner.jar
[INFO] [io.quarkus.deployment.steps.ApplyNativeImageAgentConfigStep] Applying native image agent generated files to current native executable build
Debugging the Tracing Agent Integration
If the generated native image agent configuration is not satisfactory, more information can be obtained using any of the following techniques:
Debugging Filters
Quarkus generates native image tracing agent configuration filters. These filters exclude commonly used packages for which Quarkus already applies the necessary configuration.
If native image agent is generating a configuration that it’s not working as expected, you should check that the configuration files include the expected information. For example, if some method happens to be accessed via reflection at runtime and you get an error, you want to verify that the configuration file contains a reflection entry for that method.
If the entry is missing, it could be that some call path is being filtered that maybe shouldn’t have been.
To verify that, inspect the contents of target/quarkus-caller-filter.json and target/quarkus-access-filter.json files,
and confirm that the class and/or package making the call or being accessed is not being filtered out.
If the missing entry is related to some resource, you should inspect the Quarkus build debug output and verify which resource patterns are being discarded, e.g.
$ ./mvnw -X verify -DskipITs=false -Dquarkus.test.integration-test-profile=test-with-native-agent
...
[INFO] --- quarkus:3.37.4:native-image-agent (default) @ new-project ---
...
[DEBUG] Discarding resources from native image configuration that match the following regular expression: .*(application.properties|jakarta|jboss|logging.properties|microprofile|quarkus|slf4j|smallrye|vertx).*
[DEBUG] Discarded included resource with pattern: \\QMETA-INF/microprofile-config.properties\\E
[DEBUG] Discarded included resource with pattern: \\QMETA-INF/services/io.quarkus.arc.ComponentsProvider\\E
...
Tracing Agent Logging
The native image tracing agent can log the method invocations that result in the generated configuration to a JSON file.
This can help understand why a configuration entry is generated.
To enable this logging,
-Dquarkus.test.native.agent.output.property.name=trace-output and
-Dquarkus.test.native.agent.output.property.value=native-image-agent-trace-file.json
system properties need to be added.
For example:
$ ./mvnw verify -DskipITs=false \
    -Dquarkus.test.integration-test-profile=test-with-native-agent \
    -Dquarkus.test.native.agent.output.property.name=trace-output \
    -Dquarkus.test.native.agent.output.property.value=native-image-agent-trace-file.json
When trace output is configured, no native image configuration is generated,
and instead a target/native-image-agent-trace-file.json file is generated that contains trace information.
For example:
[
{"tracer":"meta", "event":"initialization", "version":"1"},
{"tracer":"meta", "event":"phase_change", "phase":"start"},
{"tracer":"jni", "function":"FindClass", "caller_class":"java.io.ObjectStreamClass", "result":true, "args":["java/lang/NoSuchMethodError"]},
...
{"tracer":"reflect", "function":"findConstructorHandle", "class":"io.vertx.core.impl.VertxImpl$1$1$$Lambda/0x000000f80125f4e8", "caller_class":"java.lang.invoke.InnerClassLambdaMetafactory", "result":true, "args":[["io.vertx.core.Handler"]]},
{"tracer":"meta", "event":"phase_change", "phase":"dead"},
{"tracer":"meta", "event":"phase_change", "phase":"unload"}
]
Unfortunately the trace output does not take into account the applied configuration filters, so the output contains all configuration decisions made by the agent. This is unlikely to change in the near future (see oracle/graal#7635).
Configuration With Origins (Experimental)
Alternative to the trace output, it is possible to configure the native image agent with an experimental flag that shows the origins of the configuration entries. You can enable that with the following additional system property:
$ ./mvnw verify -DskipITs=false \
    -Dquarkus.test.integration-test-profile=test-with-native-agent \
    -Dquarkus.test.native.agent.additional.args=experimental-configuration-with-origins
The origins of the configuration entries can be found in text files inside the target/native-image-agent-base-config folder.
For example:
$ cat target/native-image-agent-base-config/reflect-origins.txt
root
├── java.lang.Thread#run()
│   └── java.lang.Thread#runWith(java.lang.Object,java.lang.Runnable)
│       └── io.netty.util.concurrent.FastThreadLocalRunnable#run()
│           └── org.jboss.threads.ThreadLocalResettingRunnable#run()
│               └── org.jboss.threads.DelegatingRunnable#run()
│                   └── org.jboss.threads.EnhancedQueueExecutor$ThreadBody#run()
│                       └── org.jboss.threads.EnhancedQueueExecutor$Task#run()
│                           └── org.jboss.threads.EnhancedQueueExecutor$Task#doRunWith(java.lang.Runnable,java.lang.Object)
│                               └── io.quarkus.vertx.core.runtime.VertxCoreRecorder$14#runWith(java.lang.Runnable,java.lang.Object)
│                                   └── org.jboss.resteasy.reactive.common.core.AbstractResteasyReactiveContext#run()
│                                       └── io.quarkus.resteasy.reactive.server.runtime.QuarkusResteasyReactiveRequestContext#invokeHandler(int)
│                                           └── org.jboss.resteasy.reactive.server.handlers.InvocationHandler#handle(org.jboss.resteasy.reactive.server.core.ResteasyReactiveRequestContext)
│                                               └── org.acme.GreetingResource$quarkusrestinvoker$greeting_709ef95cd764548a2bbac83843a7f4cdd8077016#invoke(java.lang.Object,java.lang.Object[])
│                                                   └── org.acme.GreetingResource#greeting(java.lang.String)
│                                                       └── org.acme.GreetingService_ClientProxy#greeting(java.lang.String)
│                                                           └── org.acme.GreetingService#greeting(java.lang.String)
│                                                               ├── java.lang.Class#forName(java.lang.String) - [ {   "name":"org.acme.Alice" }, {   "name":"org.acme.Bob" } ]
│                                                               ├── java.lang.Class#getDeclaredConstructor(java.lang.Class[]) - [ {   "name":"org.acme.Alice",   "methods":[{"name":"<init>","parameterTypes":[] }] } ]
│                                                               ├── java.lang.reflect.Constructor#newInstance(java.lang.Object[]) - [ {   "name":"org.acme.Alice",   "methods":[{"name":"<init>","parameterTypes":[] }] } ]
│                                                               ├── java.lang.reflect.Method#invoke(java.lang.Object,java.lang.Object[]) - [ {   "name":"org.acme.Alice",   "methods":[{"name":"sayMyName","parameterTypes":[] }] } ]
│                                                               └── java.lang.Class#getMethod(java.lang.String,java.lang.Class[]) - [ {   "name":"org.acme.Alice",   "methods":[{"name":"sayMyName","parameterTypes":[] }] } ]
...
Debugging With GDB
The native image agent itself is a native executable produced with GraalVM that uses JVMTI to intercept the calls that require native image configuration. As a last resort, it is possible to debug the native image agent with GDB, see here for instructions on how to do that.
Inspecting and Debugging Native Executables
This debugging guide provides further details on debugging issues in Quarkus native executables that might arise during development or production.
It takes as input the application developed in the Getting Started Guide. You can find instructions on how to quickly set up this application in this guide.
Requirements and Assumptions
This debugging guide has the following requirements:
-
JDK 17 installed with
JAVA_HOMEconfigured appropriately -
Apache Maven 3.9.16
-
一个工作的容器运行时(Docker 或 podman)
This guide builds and executes Quarkus native executables within a Linux environment. To offer a homogeneous experience across all environments, the guide relies on a container runtime environment to build and run the native executables. The instructions below use Docker as example, but very similar commands should work on alternative container runtimes, e.g. podman.
|
Building native executables is an expensive process, so make sure the container runtime has enough CPU and memory to do this. A minimum of 4 CPUs and 4GB of memory is required. |
Finally, this guide assumes the use of the Mandrel distribution of GraalVM for building native executables, and these are built within a container so there is no need for installing Mandrel on the host.
创建项目
Start by creating a new Quarkus project. Open a terminal and run the following command:
针对Linux和MacOS用户
For Windows users:
-
If using cmd, (don’t use backward slash
\and put everything on the same line) -
If using Powershell, wrap
-Dparameters in double quotes e.g."-DprojectArtifactId=debugging-native"
对于Windows用户
-
如果使用cmd ,(不要使用反斜线
\,并将所有内容放在同一行) -
If using Powershell , wrap
-Dparameters in double quotes e.g."-DprojectArtifactId=debugging-native"
Configure Quarkus properties
Some Quarkus configuration options will be used constantly throughout this debugging guide,
so to help declutter command line invocations,
it’s recommended to add these options to the application.properties file.
So, go ahead and add the following options to that file:
quarkus.native.container-build=true
quarkus.native.builder-image=quay.io/quarkus/ubi9-quarkus-mandrel-builder-image:jdk-21
quarkus.container-image.build=true
quarkus.container-image.group=test
First Debugging Steps
As a first step, change to the project directory and build the native executable for the application:
./mvnw package -DskipTests -DnativeRun the application to verify it works as expected. In one terminal:
docker run -i --rm -p 8080:8080 test/debugging-native:1.0.0-SNAPSHOTIn another:
curl -w '\n' http://localhost:8080/helloThe rest of this section explores ways to build the native executable with extra information,
but first, stop the running application.
We can obtain this information while building the native executable by adding additional native-image build options using -Dquarkus.native.additional-build-args, e.g.
./mvnw package -DskipTests -Dnative \
    -Dquarkus.native.additional-build-args=--native-image-info
Executing that will produce additional output lines like this:
...
# Printing compilation-target information to: /project/reports/target_info_20220223_100915.txt
…
# Printing native-library information to: /project/reports/native_library_info_20220223_100925.txt|
Note that |
The target info file contains information such as the target platform, the toolchain used to compile the executable, and the C library in use:
$ cat target/*/reports/target_info_*.txt
Building image for target platform: org.graalvm.nativeimage.Platform$LINUX_AMD64
Using native toolchain:
   Name: GNU project C and C++ compiler (gcc)
   Vendor: redhat
   Version: 8.5.0
   Target architecture: x86_64
   Path: /usr/bin/gcc
Using CLibrary: com.oracle.svm.core.posix.linux.libc.GLib
The native library info file contains information on the static libraries added to the binary and the other libraries dynamically linked to the executable:
$ cat target/*/reports/native_library_info_*.txt
Static libraries:
   ../opt/mandrel/lib/svm/clibraries/linux-amd64/liblibchelper.a
   ../opt/mandrel/lib/static/linux-amd64/glibc/libnet.a
   ../opt/mandrel/lib/static/linux-amd64/glibc/libextnet.a
   ../opt/mandrel/lib/static/linux-amd64/glibc/libnio.a
   ../opt/mandrel/lib/static/linux-amd64/glibc/libjava.a
   ../opt/mandrel/lib/static/linux-amd64/glibc/libfdlibm.a
   ../opt/mandrel/lib/static/linux-amd64/glibc/libsunec.a
   ../opt/mandrel/lib/static/linux-amd64/glibc/libzip.a
   ../opt/mandrel/lib/svm/clibraries/linux-amd64/libjvm.a
Other libraries: stdc++,pthread,dl,z,rt
Even more detail can be obtained by passing in --verbose as an additional native-image build argument.
This option can be very useful in detecting whether the options that you pass at a high level via Quarkus are being passed down to the native executable production,
or whether some third party jar has some native-image configuration embedded in it that is reaching the native-image invocation:
./mvnw package -DskipTests -Dnative \
    -Dquarkus.native.additional-build-args=--verbose
Running with --verbose demonstrates how the native-image building process is two sequential java processes:
-
The first is a very short Java process that does some basic validation and builds the arguments for the second process (in a stock GraalVM distribution, this is executed as native code).
-
The second Java process is where the main part of the native executable production happens. The
--verboseoption shows the actual Java process executed. You could take the output and run it yourself.
One may also combine multiple native build options by separating with a comma, e.g.:
./mvnw package -DskipTests -Dnative \
-Dquarkus.native.additional-build-args=--native-image-info,--verbose|
Remember that if an argument for |
Inspecting Native Executables
Given a native executable, various Linux tools can be used to inspect it. To allow supporting a variety of environments, inspections will be done from within a Linux container. Let’s create a Linux container image with all the tools required for this guide:
FROM fedora:35

RUN dnf install -y \
binutils \
gdb \
git \
perf \
perl-open

ENV FG_HOME /opt/FlameGraph

RUN git clone https://github.com/brendangregg/FlameGraph $FG_HOME

WORKDIR /data

ENTRYPOINT /bin/bash
Using docker in the non-Linux environment, you can create an image using this Dockerfile via:
docker build -t fedora-tools:v1 .Then, go to the root of the project and run the Docker container we have just created as:
docker run -t -i --rm -v ${PWD}:/data -p 8080:8080 fedora-tools:v1ldd shows the shared library dependencies of an executable:
ldd ./target/debugging-native-1.0.0-SNAPSHOT-runnerstrings can be used to look for text messages inside the binary:
strings ./target/debugging-native-1.0.0-SNAPSHOT-runner | grep HelloUsing strings you can also get Mandrel information given the binary:
strings ./target/debugging-native-1.0.0-SNAPSHOT-runner | grep core.VMFinally, using readelf we can inspect different sections of the binary.
For example, we can see how the heap and text sections take most of the binary:
readelf -SW ./target/debugging-native-1.0.0-SNAPSHOT-runner|
Runtime containers produced by Quarkus to run native executables will not include the tools mentioned above.
To explore a native executable within a runtime container,
it’s best to run the container itself and then From there, you can either inspect the executable directly or use a tools container like above. |
Native Reports
Optionally, the native build process can generate reports that show what goes into the binary:
./mvnw package -DskipTests -Dnative \
    -Dquarkus.native.enable-reports
The reports will be created under target/debugging-native-1.0.0-SNAPSHOT-native-image-source-jar/reports/.
These reports are some of the most useful resources when encountering issues with missing methods/classes, or encountering forbidden methods by Mandrel.
Call Tree Reports
call_tree csv file reports are some of the default reports generated when the -Dquarkus.native.enable-reports option is passed in.
These csv files can be imported into a graph database, such as Neo4j,
to inspect them more easily and run queries against the call tree.
This is useful for getting an approximation on why a method/class is included in the binary.
Let’s see this in action.
First, start a Neo4j instance:
export NEO_PASS=...
docker run \
    --detach \
    --rm \
    --name testneo4j \
    -p7474:7474 -p7687:7687 \
    --env NEO4J_AUTH=neo4j/${NEO_PASS} \
    neo4j:latest
Once the container is running,
you can access the Neo4j browser.
Use neo4j as the username and the value of NEO_PASS as the password to log in.
To import the CSV files, we need the following cypher script which will import the data within the CSV files and create graph database nodes and edges:
CREATE CONSTRAINT unique_vm_id FOR (v:VM) REQUIRE v.vmId IS UNIQUE;
CREATE CONSTRAINT unique_method_id FOR (m:Method) REQUIRE m.methodId IS UNIQUE;

LOAD CSV WITH HEADERS FROM 'file:///reports/call_tree_vm.csv' AS row
MERGE (v:VM {vmId: row.Id, name: row.Name})
RETURN count(v);

LOAD CSV WITH HEADERS FROM 'file:///reports/call_tree_methods.csv' AS row
MERGE (m:Method {methodId: row.Id, name: row.Name, type: row.Type, parameters: row.Parameters, return: row.Return, display: row.Display})
RETURN count(m);

LOAD CSV WITH HEADERS FROM 'file:///reports/call_tree_virtual_methods.csv' AS row
MERGE (m:Method {methodId: row.Id, name: row.Name, type: row.Type, parameters: row.Parameters, return: row.Return, display: row.Display})
RETURN count(m);

LOAD CSV WITH HEADERS FROM 'file:///reports/call_tree_entry_points.csv' AS row
MATCH (m:Method {methodId: row.Id})
MATCH (v:VM {vmId: '0'})
MERGE (v)-[:ENTRY]->(m)
RETURN count(*);

LOAD CSV WITH HEADERS FROM 'file:///reports/call_tree_direct_edges.csv' AS row
MATCH (m1:Method {methodId: row.StartId})
MATCH (m2:Method {methodId: row.EndId})
MERGE (m1)-[:DIRECT {bci: row.BytecodeIndexes}]->(m2)
RETURN count(*);

LOAD CSV WITH HEADERS FROM 'file:///reports/call_tree_override_by_edges.csv' AS row
MATCH (m1:Method {methodId: row.StartId})
MATCH (m2:Method {methodId: row.EndId})
MERGE (m1)-[:OVERRIDEN_BY]->(m2)
RETURN count(*);

LOAD CSV WITH HEADERS FROM 'file:///reports/call_tree_virtual_edges.csv' AS row
MATCH (m1:Method {methodId: row.StartId})
MATCH (m2:Method {methodId: row.EndId})
MERGE (m1)-[:VIRTUAL {bci: row.BytecodeIndexes}]->(m2)
RETURN count(*);
Copy and paste the contents of the script into a file called import.cypher.
|
Mandrel 22.0.0 contains a bug where the symbolic links used by the import cypher file are not correctly set when generating reports within a container (for more details see here). This can be worked around by copying the following script into a file and executing it: |
Next, copy the import cypher script and CSV files into Neo4j’s import folder:
docker cp \
    target/*-native-image-source-jar/reports \
    testneo4j:/var/lib/neo4j/import

docker cp import.cypher testneo4j:/var/lib/neo4j
After copying all the files, invoke the import script:
docker exec testneo4j bin/cypher-shell -u neo4j -p ${NEO_PASS} -f import.cypherOnce the import completes (shouldn’t take more than a couple of minutes), go to the Neo4j browser, and you’ll be able to observe a small summary of the data in the graph:
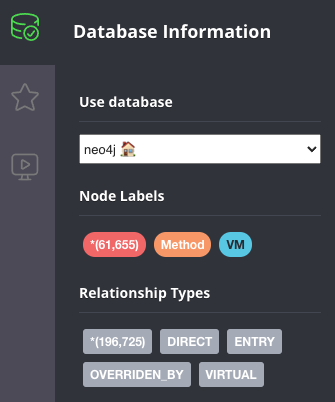
The data above shows that there are ~60000 methods, and just over ~200000 edges between them. The Quarkus application demonstrated here is very basic, so there’s not a lot we can explore, but here are some example queries you can run to explore the graph in more detail. Typically, you’d start by looking for a given method:
match (m:Method) where m.name = "hello" return *From there, you can narrow down to a given method on a specific type:
match (m:Method) where m.name = "hello" and m.type =~ ".*GreetingResource" return *Once you’ve located the node for the specific method you’re after, a typical question you’d want to get an answer for is: why does this method get included in the call tree? To do that, start from the method and look for incoming connections at a given depth, starting from the end method. For example, methods that directly call a method can be located via:
match (m:Method) <- [*1..1] - (o) where m.name = "hello" and m.type =~ ".*GreetingResource" return *Then you can look for direct calls at depth of 2, so you’d search for methods that call methods that call into the target method:
match (m:Method) <- [*1..2] - (o) where m.name = "hello" and m.type =~ ".*GreetingResource" return *You can continue going up layers, but unfortunately if you reach a depth with too many nodes, the Neo4j browser will be unable to visualize them all. When that happens, you can alternatively run the queries directly against the cypher shell:
docker exec testneo4j bin/cypher-shell -u neo4j -p ${NEO_PASS} \
  "match (m:Method) <- [*1..10] - (o) where m.name = 'hello' and m.type =~ '.*GreetingResource' return *"
For further information, check out this blog post that explores the Quarkus Hibernate ORM quickstart using the techniques explained above.
Used Packages/Classes/Methods Reports
used_packages, used_classes and used_methods text file reports come in handy when comparing different versions of the application,
e.g. why does the image take longer to build? Or why is the image bigger now?
Further Reports
Mandrel can produce further reports beyond the ones that are enabled with the -Dquarkus.native.enable-reports option.
These are called expert options and you can learn more about them by running:
docker run quay.io/quarkus/ubi9-quarkus-mandrel-builder-image:jdk-21 --expert-options-all|
These expert options are not considered part of the GraalVM native image API, so they might change anytime. |
To use these expert options, add them comma separated to the -Dquarkus.native.additional-build-args parameter.
Build-time vs Run-time Initialization
Quarkus instructs Mandrel to initialize as much as possible at build time, so that runtime startup can be as fast as possible. This is important in containerized environments where the startup speed has a big impact on how quickly an application is ready to do work. Build time initialization also minimizes the risk of runtime failures due to unsupported features becoming reachable through runtime initialization, thus making Quarkus more reliable.
The most common examples of build-time initialized code are static variables and blocks. Although Mandrel executes those at run-time by default, Quarkus instructs Mandrel to run them at build-time for the reasons given.
This means that any static variables initialized inline, or initialized in a static block, will keep the same value even if the application is restarted. This is a different behaviour compared to what would happen if executed as Java.
To see this in action with a very basic example,
add a new TimestampResource to the application that looks like this:
package org.acme;

import jakarta.ws.rs.GET;
import jakarta.ws.rs.Path;
import jakarta.ws.rs.Produces;
import jakarta.ws.rs.core.MediaType;

@Path("/timestamp")
public class TimestampResource {

    static long firstAccess = System.currentTimeMillis();

    @GET
    @Produces(MediaType.TEXT_PLAIN)
    public String timestamp() {
        return "First access " + firstAccess;
    }
}
Rebuild the binary using:
./mvnw package -DskipTests -DnativeRun the application in one terminal (make sure you stop any other native executable container runs before executing this):
docker run -i --rm -p 8080:8080 test/debugging-native:1.0.0-SNAPSHOTSend a GET request multiple times from another terminal:
curl -w '\n' http://localhost:8080/timestamp # run this multiple timesto see how the current time has been baked into the binary. This time was calculated when the binary was being built, hence application restarts have no effect.
In some situations, built time initializations can lead to errors when building native executables. One example is when a value gets computed at build time which is forbidden to reside in the heap of the JVM that gets baked into the binary. To see this in action, add this REST resource:
package org.acme;

import javax.crypto.Cipher;
import javax.crypto.NoSuchPaddingException;
import jakarta.ws.rs.GET;
import jakarta.ws.rs.Path;
import java.nio.charset.StandardCharsets;
import java.security.KeyPair;
import java.security.KeyPairGenerator;
import java.security.NoSuchAlgorithmException;

@Path("/encrypt-decrypt")
public class EncryptDecryptResource {

    static final KeyPairGenerator KEY_PAIR_GEN;
    static final Cipher CIPHER;

    static {
        try {
            KEY_PAIR_GEN = KeyPairGenerator.getInstance("RSA");
            KEY_PAIR_GEN.initialize(1024);

            CIPHER = Cipher.getInstance("RSA");
        } catch (NoSuchAlgorithmException | NoSuchPaddingException e) {
            throw new RuntimeException(e);
        }
    }

    @GET
    @Path("/{message}")
    public String encryptDecrypt(String message) throws Exception {
        KeyPair keyPair = KEY_PAIR_GEN.generateKeyPair();

        byte[] text = message.getBytes(StandardCharsets.UTF_8);

        // Encrypt with private key
        CIPHER.init(Cipher.ENCRYPT_MODE, keyPair.getPrivate());
        byte[] encrypted = CIPHER.doFinal(text);

        // Decrypt with public key
        CIPHER.init(Cipher.DECRYPT_MODE, keyPair.getPublic());
        byte[] unencrypted = CIPHER.doFinal(encrypted);

        return new String(unencrypted, StandardCharsets.UTF_8);
    }
}
When trying to rebuild the application, you’ll encounter an error:
./mvnw package -DskipTests -Dnative
...
Error: Unsupported features in 2 methods
Detailed message:
Error: Detected an instance of Random/SplittableRandom class in the image heap. Instances created during image generation have cached seed values and don't behave as expected.  To see how this object got instantiated use --trace-object-instantiation=java.security.SecureRandom. The object was probably created by a class initializer and is reachable from a static field. You can request class initialization at image runtime by using the option --initialize-at-run-time=<class-name>. Or you can write your own initialization methods and call them explicitly from your main entry point.
Trace: Object was reached by
	reading field java.security.KeyPairGenerator$Delegate.initRandom of
		constant java.security.KeyPairGenerator$Delegate@58b0fe1b reached by
	reading field org.acme.EncryptDecryptResource.KEY_PAIR_GEN
Error: Detected an instance of Random/SplittableRandom class in the image heap. Instances created during image generation have cached seed values and don't behave as expected.  To see how this object got instantiated use --trace-object-instantiation=java.security.SecureRandom. The object was probably created by a class initializer and is reachable from a static field. You can request class initialization at image runtime by using the option --initialize-at-run-time=<class-name>. Or you can write your own initialization methods and call them explicitly from your main entry point.
Trace: Object was reached by
	reading field sun.security.rsa.RSAKeyPairGenerator.random of
		constant sun.security.rsa.RSAKeyPairGenerator$Legacy@3248a092 reached by
	reading field java.security.KeyPairGenerator$Delegate.spi of
		constant java.security.KeyPairGenerator$Delegate@58b0fe1b reached by
	reading field org.acme.EncryptDecryptResource.KEY_PAIR_GEN
So, what the message above is telling us is that our application caches a value that is supposed to be random as a constant. This is not desirable because something that’s supposed to be random is no longer so, because the seed is baked in the image. The message above makes it quite clear what is causing this, but in other situations the cause might be more obfuscated. As a next step, we’ll add some extra flags to the native executable generation to get more information.
As suggested by the message, let’s start by adding an option to track object instantiation:
./mvnw package -DskipTests -Dnative \
    -Dquarkus.native.additional-build-args="--trace-object-instantiation=java.security.SecureRandom"
...
Error: Unsupported features in 2 methods
Detailed message:
Error: Detected an instance of Random/SplittableRandom class in the image heap. Instances created during image generation have cached seed values and don't behave as expected.  Object has been initialized by the com.sun.jndi.dns.DnsClient class initializer with a trace:
 	at java.security.SecureRandom.<init>(SecureRandom.java:218)
	at sun.security.jca.JCAUtil$CachedSecureRandomHolder.<clinit>(JCAUtil.java:59)
	at sun.security.jca.JCAUtil.getSecureRandom(JCAUtil.java:69)
	at com.sun.jndi.dns.DnsClient.<clinit>(DnsClient.java:82)
. Try avoiding to initialize the class that caused initialization of the object. The object was probably created by a class initializer and is reachable from a static field. You can request class initialization at image runtime by using the option --initialize-at-run-time=<class-name>. Or you can write your own initialization methods and call them explicitly from your main entry point.
Trace: Object was reached by
	reading field java.security.KeyPairGenerator$Delegate.initRandom of
		constant java.security.KeyPairGenerator$Delegate@4a5058f9 reached by
	reading field org.acme.EncryptDecryptResource.KEY_PAIR_GEN
Error: Detected an instance of Random/SplittableRandom class in the image heap. Instances created during image generation have cached seed values and don't behave as expected.  Object has been initialized by the com.sun.jndi.dns.DnsClient class initializer with a trace:
 	at java.security.SecureRandom.<init>(SecureRandom.java:218)
	at sun.security.jca.JCAUtil$CachedSecureRandomHolder.<clinit>(JCAUtil.java:59)
	at sun.security.jca.JCAUtil.getSecureRandom(JCAUtil.java:69)
	at com.sun.jndi.dns.DnsClient.<clinit>(DnsClient.java:82)
. Try avoiding to initialize the class that caused initialization of the object. The object was probably created by a class initializer and is reachable from a static field. You can request class initialization at image runtime by using the option --initialize-at-run-time=<class-name>. Or you can write your own initialization methods and call them explicitly from your main entry point.
Trace: Object was reached by
	reading field sun.security.rsa.RSAKeyPairGenerator.random of
		constant sun.security.rsa.RSAKeyPairGenerator$Legacy@71880cf1 reached by
	reading field java.security.KeyPairGenerator$Delegate.spi of
		constant java.security.KeyPairGenerator$Delegate@4a5058f9 reached by
	reading field org.acme.EncryptDecryptResource.KEY_PAIR_GEN
The error messages point to the code in the example,
but it can be surprising that a reference to DnsClient appears.
Why is that?
The key is in what happens inside KeyPairGenerator.initialize() method call.
It uses JCAUtil.getSecureRandom() which is why this is problematic,
but sometimes the tracing options can show some stack traces that do not represent what happens in reality.
The best option is to dig through the source code and use tracing output for guidance but not as full truth.
Moving the KEY_PAIR_GEN.initialize(1024); call to the run-time executed method encryptDecrypt is enough to solve this particular issue.
Rebuild the application and verify that encrypt/decrypt endpoint works as expected by sending any message and check if the reply is the same as the incoming message:
$ ./mvnw package -DskipTests -Dnative
...
$ docker run -i --rm -p 8080:8080 test/debugging-native:1.0.0-SNAPSHOT
...
$ curl -w '\n' http://localhost:8080/encrypt-decrypt/hellomandrel
hellomandrel
Additional information on which classes are initialized and why can be obtained by passing in the -H:+PrintClassInitialization flag via -Dquarkus.native.additional-build-args.
Profile Runtime Behaviour
Single Thread
In this exercise, we profile the runtime behaviour of some Quarkus application that was compiled to a native executable to determine where the bottleneck is. Assume that you’re in a scenario where profiling the pure Java version is not possible, maybe because the issue only occurs with the native version of the application.
Add a REST resource with the following code (example courtesy of Andrei Pangin’s Java Profiling presentation):
package org.acme;

import jakarta.ws.rs.GET;
import jakarta.ws.rs.Path;
import jakarta.ws.rs.Produces;
import jakarta.ws.rs.core.MediaType;

@Path("/string-builder")
public class StringBuilderResource {

    @GET
    @Produces(MediaType.TEXT_PLAIN)
    public String appendDelete() {
        StringBuilder sb = new StringBuilder();
        sb.append(new char[1_000_000]);

        do
        {
            sb.append(12345);
            sb.delete(0, 5);
        } while (Thread.currentThread().isAlive());

        return "Never happens";
    }
}
Recompile the application, rebuild the binary and run it. Attempting a simple curl will never complete, as expected:
$ ./mvnw package -DskipTests -Dnative
...
$ docker run -i --rm -p 8080:8080 test/debugging-native:1.0.0-SNAPSHOT
...
$ curl http://localhost:8080/string-builder # this will never complete
However, the question we’re trying to answer here is: what would be the bottleneck of such code? Is it appending the characters? Is it deleting it? Is it checking whether the thread is alive?
Since we’re dealing with a linux native executable,
we can use tools like perf directly.
To use perf,
go to the root of the project and start the tools container created earlier as a privileged user:
docker run --privileged -t -i --rm -v ${PWD}:/data -p 8080:8080 fedora-tools:v1|
Note that in order to use |
Once the container is running, you need to ensure that the kernel is ready for the profiling exercises:
echo -1 | sudo tee /proc/sys/kernel/perf_event_paranoid
echo 0 | sudo tee /proc/sys/kernel/kptr_restrict|
The kernel modifications above also apply to Linux virtual machines.
If running on a bare metal Linux machine,
tweaking only |
Then, from inside the tools container we execute:
perf record -F 1009 -g -a ./target/debugging-native-1.0.0-SNAPSHOT-runner|
The |
While perf record is running, open another window and access the endpoint:
curl http://localhost:8080/string-builder # this will never completeAfter a few seconds, halt the perf record process.
This will generate a perf.data file.
We could use perf report to inspect the perf data,
but you can often get a better picture showing that data as a flame graph.
To generate flame graphs, we will use
FlameGraph GitHub repository,
which has already been installed inside the tools container.
Next, generate a flame graph using the data captured via perf record:
perf script -i perf.data | ${FG_HOME}/stackcollapse-perf.pl | ${FG_HOME}/flamegraph.pl > flamegraph.svgThe flame graph is a svg file that a web browser, such as Firefox, can easily display.
After the above two commands complete one can open flamegraph.svg in their browser:

We see a big majority of time spent in what is supposed to be our main,
but we see no trace of the StringBuilderResource class,
nor the StringBuilder class we’re calling.
We should look at the symbol table of the binary:
can we find symbols for our class and StringBuilder?
We need those in order to get meaningful data.
From within the tools container, query the symbol table:
objdump -t ./target/debugging-native-1.0.0-SNAPSHOT-runner | grep StringBuilder
[no output]
No output appears when querying the symbol table. This is why we don’t see any call graphs in the flame graphs. This is a deliberate decision that native-image makes. By default, it removes symbols from the binary.
To regain the symbols, we need to rebuild the binary instructing GraalVM not to delete the symbols. On top of that, enable DWARF debug info so that the stack traces can be populated with that information. From outside the tools container, execute:
./mvnw package -DskipTests -Dnative \
    -Dquarkus.native.debug.enabled \
    -Dquarkus.native.additional-build-args=-H:-DeleteLocalSymbols
Next, re-enter the tools container if you exited,
and inspect the native executable with objdump,
and see how the symbols are now present:
$ objdump -t ./target/debugging-native-1.0.0-SNAPSHOT-runner | grep StringBuilder
000000000050a940 l     F .text	0000000000000091              .hidden ReflectionAccessorHolder_StringBuilderResource_appendDelete_9e06d4817d0208a0cce97ebcc0952534cac45a19_e22addf7d3eaa3ad14013ce01941dc25beba7621
000000000050a9e0 l     F .text	00000000000000bb              .hidden ReflectionAccessorHolder_StringBuilderResource_constructor_0f8140ea801718b80c05b979a515d8a67b8f3208_12baae06bcd6a1ef9432189004ae4e4e176dd5a4
...
You should see a long list of symbols that match that pattern.
Then, run the executable through perf, indicating that the call graph is dwarf:
perf record -F 1009 --call-graph dwarf -a ./target/debugging-native-1.0.0-SNAPSHOT-runnerRun the curl command once again, stop the binary, generate the flamegraphs and open it:
perf script -i perf.data | ${FG_HOME}/stackcollapse-perf.pl | ${FG_HOME}/flamegraph.pl > flamegraph.svgThe flamegraph now shows where the bottleneck is.
It’s when StringBuilder.delete() is called which calls System.arraycopy().
The issue is that 1 million characters need to be shifted in very small increments:

Multi-Thread
Multithreaded programs might require special attention when trying to understand their runtime behaviour.
To demonstrate this, add this MulticastResource code to your project
(example courtesy of Andrei Pangin’s Java Profiling presentation):
package org.acme;

import jakarta.ws.rs.GET;
import jakarta.ws.rs.Path;
import jakarta.ws.rs.Produces;
import jakarta.ws.rs.core.MediaType;
import java.net.InetSocketAddress;
import java.nio.ByteBuffer;
import java.nio.channels.DatagramChannel;
import java.util.concurrent.ExecutorService;
import java.util.concurrent.Executors;
import java.util.concurrent.ThreadFactory;
import java.util.concurrent.atomic.AtomicInteger;

@Path("/multicast")
public class MulticastResource
{
    @GET
    @Produces(MediaType.TEXT_PLAIN)
    public String send() throws Exception {
        sendMulticasts();
        return "Multicast packets sent";
    }

    static void sendMulticasts() throws Exception {
        DatagramChannel ch = DatagramChannel.open();
        ch.bind(new InetSocketAddress(5555));
        ch.configureBlocking(false);

        ExecutorService pool =
            Executors.newCachedThreadPool(new ShortNameThreadFactory());
        for (int i = 0; i < 10; i++) {
            pool.submit(() -> {
                final ByteBuffer buf = ByteBuffer.allocateDirect(1000);
                final InetSocketAddress remoteAddr =
                    new InetSocketAddress("127.0.0.1", 5556);

                while (true) {
                    buf.clear();
                    ch.send(buf, remoteAddr);
                }
            });
        }

        System.out.println("Warming up...");
        Thread.sleep(3000);

        System.out.println("Benchmarking...");
        Thread.sleep(5000);
    }

    private static final class ShortNameThreadFactory implements ThreadFactory {

        private final AtomicInteger threadNumber = new AtomicInteger(1);
        private final String namePrefix = "thread-";

        public Thread newThread(Runnable r) {
            return new Thread(r, namePrefix + threadNumber.getAndIncrement());
        }
    }
}
Build the native executable with debug info:
./mvnw package -DskipTests -Dnative \
    -Dquarkus.native.debug.enabled \
    -Dquarkus.native.additional-build-args=-H:-DeleteLocalSymbols
From inside the tools container (as privileged user) run the native executable through perf:
perf record -F 1009 --call-graph dwarf -a ./target/debugging-native-1.0.0-SNAPSHOT-runnerInvoke the endpoint to send the multicast packets:
curl -w '\n' http://localhost:8080/multicastMake and open a flamegraph:
perf script -i perf.data | ${FG_HOME}/stackcollapse-perf.pl | ${FG_HOME}/flamegraph.pl > flamegraph.svg
The flamegraph produced looks odd. Each thread is treated independently even though they all do the same work. This makes it difficult to have a clear picture of the bottlenecks in the program.
This is happening because from a perf perspective, each thread is a different command.
We can see that if we inspect perf report:
perf report --stdio
# Children      Self  Command          Shared Object       Symbol
# ........  ........  ...............  ......................................  ......................................................................................
...
     6.95%     0.03%  thread-2         debugging-native-1.0.0-SNAPSHOT-runner  [.] MulticastResource_lambda$sendMulticasts$0_cb1f7b5dcaed7dd4e3f90d18bad517d67eae4d88
...
     4.60%     0.02%  thread-10        debugging-native-1.0.0-SNAPSHOT-runner  [.] MulticastResource_lambda$sendMulticasts$0_cb1f7b5dcaed7dd4e3f90d18bad517d67eae4d88
...
This can be worked around by applying some modifications to the perf output, in order to make all threads have the same name. E.g.
perf script | sed -E "s/thread-[0-9]*/thread/" | ${FG_HOME}/stackcollapse-perf.pl | ${FG_HOME}/flamegraph.pl > flamegraph.svg
When you open the flamegraph, you will see all threads' work collapsed into a single area. Then, you can clearly see that there’s some locking that could affect performance.
Debugging Native Crashes
One of the drawbacks of using native executables is that they cannot be debugged using the standard Java debuggers,
instead we need to debug them using gdb, the GNU Project debugger.
To demonstrate how to do this,
we are going to generate a native Quarkus application that crashes due to a Segmentation Fault when accessing http://localhost:8080/crash.
To achieve this, add the following REST resource to the project:
package org.acme;

import sun.misc.Unsafe;

import jakarta.ws.rs.GET;
import jakarta.ws.rs.Path;
import jakarta.ws.rs.Produces;
import jakarta.ws.rs.core.MediaType;
import java.lang.reflect.Field;

@Path("/crash")
public class CrashResource {

    @GET
    @Produces(MediaType.TEXT_PLAIN)
    public String hello() {
        Field theUnsafe = null;
        try {
            theUnsafe = Unsafe.class.getDeclaredField("theUnsafe");
            theUnsafe.setAccessible(true);
            Unsafe unsafe = (Unsafe) theUnsafe.get(null);
            unsafe.copyMemory(0, 128, 256);
        } catch (NoSuchFieldException | IllegalAccessException e) {
            e.printStackTrace();
        }
        return "Never happens";
    }
}
This code will try to copy 256 bytes from address 0x0 to 0x80 resulting in a Segmentation Fault.
To verify this, compile and run the example application:
$ ./mvnw package -DskipTests -Dnative
...
$ docker run -i --rm -p 8080:8080 test/debugging-native:1.0.0-SNAPSHOT
...
$ curl http://localhost:8080/crash
This will result in the following output:
$ docker run -i --rm -p 8080:8080 test/debugging-native:1.0.0-SNAPSHOT
...
Segfault detected, aborting process. Use runtime option -R:-InstallSegfaultHandler if you don't want to use SubstrateSegfaultHandler.
...
The omitted output above contains clues to what caused the issue,
but in this exercise we are going to assume that no information was provided.
Let’s try to debug the segmentation fault using gdb.
To do that, go to the root of the project and enter the tools container:
docker run -t -i --rm -v ${PWD}:/data -p 8080:8080 fedora-tools:v1 /bin/bashThen start the application in gdb and execute run.
gdb ./target/debugging-native-1.0.0-SNAPSHOT-runner
...
Reading symbols from ./target/debugging-native-1.0.0-SNAPSHOT-runner...
(No debugging symbols found in ./target/debugging-ntaive-1.0.0-SNAPSHOT-runner)
(gdb) run
Starting program: /data/target/debugging-native-1.0.0-SNAPSHOT-runner
Next, try to access http://localhost:8080/crash:
curl http://localhost:8080/crashThis will result in the following message in gdb:
Thread 4 "ecutor-thread-0" received signal SIGSEGV, Segmentation fault.
[Switching to Thread 0x7fe103dff640 (LWP 190)]
0x0000000000461f6e in ?? ()
If we try to get more info about the backtrace that led to this crash we will see that there is not enough information available.
(gdb) bt
#0  0x0000000000418b5e in ?? ()
#1  0x00007ffff6f2d328 in ?? ()
#2  0x0000000000418a04 in ?? ()
#3  0x00007ffff44062a0 in ?? ()
#4  0x00000000010c3dd3 in ?? ()
#5  0x0000000000000100 in ?? ()
#6  0x0000000000000000 in ?? ()
This is because we didn’t compile the Quarkus application with -Dquarkus.native.debug.enabled,
so gdb cannot find debugging symbols for our native executable,
as indicated by the "No debugging symbols found in ./target/debugging-native-1.0.0-SNAPSHOT-runner" message in the beginning of gdb.
Recompiling the Quarkus application with -Dquarkus.native.debug.enabled and rerunning it through gdb we are now able to get a backtrace making clear what caused the crash.
On top of that, add -H:-OmitInlinedMethodDebugLineInfo option to avoid inlined methods being omitted from the backtrace:
./mvnw package -DskipTests -Dnative \
    -Dquarkus.native.debug.enabled \
    -Dquarkus.native.additional-build-args=-H:-OmitInlinedMethodDebugLineInfo
...
$ gdb ./target/debugging-native-1.0.0-SNAPSHOT-runner
Reading symbols from ./target/debugging-native-1.0.0-SNAPSHOT-runner...
(gdb) run
Starting program: /data/target/debugging-native-1.0.0-SNAPSHOT-runner
...
$ curl http://localhost:8080/crash
This will result in the following message in gdb:
Thread 4 "ecutor-thread-0" received signal SIGSEGV, Segmentation fault.
[Switching to Thread 0x7fffeffff640 (LWP 362984)]
com.oracle.svm.core.UnmanagedMemoryUtil::copyLongsBackward(org.graalvm.word.Pointer *, org.graalvm.word.Pointer *, org.graalvm.word.UnsignedWord *) ()
	at com/oracle/svm/core/UnmanagedMemoryUtil.java:169
169    com/oracle/svm/core/UnmanagedMemoryUtil.java: No such file or directory.
We already see that gdb is able to tell us which method caused the crash and where it’s located in the source code.
We can also get a backtrace of the call graph that led us to this state:
(gdb) bt
#0  com.oracle.svm.core.UnmanagedMemoryUtil::copyLongsBackward(org.graalvm.word.Pointer *, org.graalvm.word.Pointer *, org.graalvm.word.UnsignedWord *) () at com/oracle/svm/core/UnmanagedMemoryUtil.java:169
#1  0x0000000000461e14 in com.oracle.svm.core.UnmanagedMemoryUtil::copyBackward(org.graalvm.word.Pointer *, org.graalvm.word.Pointer *, org.graalvm.word.UnsignedWord *) () at com/oracle/svm/core/UnmanagedMemoryUtil.java:110
#2  0x0000000000461dc8 in com.oracle.svm.core.UnmanagedMemoryUtil::copy(org.graalvm.word.Pointer *, org.graalvm.word.Pointer *, org.graalvm.word.UnsignedWord *) () at com/oracle/svm/core/UnmanagedMemoryUtil.java:67
#3  0x000000000045d3c0 in com.oracle.svm.core.JavaMemoryUtil::unsafeCopyMemory(java.lang.Object *, long, java.lang.Object *, long, long) () at com/oracle/svm/core/JavaMemoryUtil.java:276
#4  0x00000000013277de in jdk.internal.misc.Unsafe::copyMemory0 () at com/oracle/svm/core/jdk/SunMiscSubstitutions.java:125
#5  jdk.internal.misc.Unsafe::copyMemory(java.lang.Object *, long, java.lang.Object *, long, long) () at jdk/internal/misc/Unsafe.java:788
#6  0x00000000013b1a3f in jdk.internal.misc.Unsafe::copyMemory () at jdk/internal/misc/Unsafe.java:799
#7  sun.misc.Unsafe::copyMemory () at sun/misc/Unsafe.java:585
#8  org.acme.CrashResource::hello(void) () at org/acme/CrashResource.java:22
Similarly, we can get a backtrace of the call graph of other threads.
-
First, we can list the available threads with:
(gdb) info threads Id Target Id Frame 1 Thread 0x7fcc62a07d00 (LWP 322) "debugging-nativ" 0x00007fcc62b8b77a in __futex_abstimed_wait_common () from /lib64/libc.so.6 2 Thread 0x7fcc60eff640 (LWP 326) "gnal Dispatcher" 0x00007fcc62b8b77a in __futex_abstimed_wait_common () from /lib64/libc.so.6 * 4 Thread 0x7fcc5b7fe640 (LWP 328) "ecutor-thread-0" com.oracle.svm.core.UnmanagedMemoryUtil::copyLongsBackward(org.graalvm.word.Pointer *, org.graalvm.word.Pointer *, org.graalvm.word.UnsignedWord *) () at com/oracle/svm/core/UnmanagedMemoryUtil.java:169 5 Thread 0x7fcc5abff640 (LWP 329) "-thread-checker" 0x00007fcc62b8b77a in __futex_abstimed_wait_common () from /lib64/libc.so.6 6 Thread 0x7fcc59dff640 (LWP 330) "ntloop-thread-0" 0x00007fcc62c12c9e in epoll_wait () from /lib64/libc.so.6 ... -
select the thread we want to inspect, e.g. thread 1:
(gdb) thread 1 [Switching to thread 1 (Thread 0x7ffff7a58d00 (LWP 1028851))] #0 __futex_abstimed_wait_common64 (private=0, cancel=true, abstime=0x0, op=393, expected=0, futex_word=0x2cd7adc) at futex-internal.c:57 57 return INTERNAL_SYSCALL_CANCEL (futex_time64, futex_word, op, expected, -
and, finally, print the stack trace:
(gdb) bt
#0  __futex_abstimed_wait_common64 (private=0, cancel=true, abstime=0x0, op=393, expected=0, futex_word=0x2cd7adc) at futex-internal.c:57
#1  __futex_abstimed_wait_common (futex_word=futex_word@entry=0x2cd7adc, expected=expected@entry=0, clockid=clockid@entry=0, abstime=abstime@entry=0x0, private=private@entry=0,
    cancel=cancel@entry=true) at futex-internal.c:87
#2  0x00007ffff7bdd79f in __GI___futex_abstimed_wait_cancelable64 (futex_word=futex_word@entry=0x2cd7adc, expected=expected@entry=0, clockid=clockid@entry=0, abstime=abstime@entry=0x0,
    private=private@entry=0) at futex-internal.c:139
#3  0x00007ffff7bdfeb0 in __pthread_cond_wait_common (abstime=0x0, clockid=0, mutex=0x2ca07b0, cond=0x2cd7ab0) at pthread_cond_wait.c:504
#4  ___pthread_cond_wait (cond=0x2cd7ab0, mutex=0x2ca07b0) at pthread_cond_wait.c:619
#5  0x00000000004e2014 in com.oracle.svm.core.posix.headers.Pthread::pthread_cond_wait () at com/oracle/svm/core/posix/thread/PosixJavaThreads.java:252
#6  com.oracle.svm.core.posix.thread.PosixParkEvent::condWait(void) () at com/oracle/svm/core/posix/thread/PosixJavaThreads.java:252
#7  0x0000000000547070 in com.oracle.svm.core.thread.JavaThreads::park(void) () at com/oracle/svm/core/thread/JavaThreads.java:764
#8  0x0000000000fc5f44 in jdk.internal.misc.Unsafe::park(boolean, long) () at com/oracle/svm/core/thread/Target_jdk_internal_misc_Unsafe_JavaThreads.java:49
#9  0x0000000000eac1ad in java.util.concurrent.locks.LockSupport::park(java.lang.Object *) () at java/util/concurrent/locks/LockSupport.java:194
#10 0x0000000000ea5d68 in java.util.concurrent.locks.AbstractQueuedSynchronizer$ConditionObject::awaitUninterruptibly(void) ()
    at java/util/concurrent/locks/AbstractQueuedSynchronizer.java:2018
#11 0x00000000008b6b30 in io.quarkus.runtime.ApplicationLifecycleManager::run(io.quarkus.runtime.Application *, java.lang.Class *, java.util.function.BiConsumer *, java.lang.String[] *) ()
    at io/quarkus/runtime/ApplicationLifecycleManager.java:144
#12 0x00000000008bc055 in io.quarkus.runtime.Quarkus::run(java.lang.Class *, java.util.function.BiConsumer *, java.lang.String[] *) () at io/quarkus/runtime/Quarkus.java:67
#13 0x000000000045c88b in io.quarkus.runtime.Quarkus::run () at io/quarkus/runtime/Quarkus.java:41
#14 io.quarkus.runtime.Quarkus::run () at io/quarkus/runtime/Quarkus.java:120
#15 0x000000000045c88b in io.quarkus.runner.GeneratedMain::main ()
#16 com.oracle.svm.core.JavaMainWrapper::runCore () at com/oracle/svm/core/JavaMainWrapper.java:150
#17 com.oracle.svm.core.JavaMainWrapper::run(int, org.graalvm.nativeimage.c.type.CCharPointerPointer *) () at com/oracle/svm/core/JavaMainWrapper.java:186
#18 0x000000000048084d in com.oracle.svm.core.code.IsolateEnterStub::JavaMainWrapper_run_5087f5482cc9a6abc971913ece43acb471d2631b(int, org.graalvm.nativeimage.c.type.CCharPointerPointer *)
    () at com/oracle/svm/core/JavaMainWrapper.java:280
Alternatively, we can list the backtraces of all threads with a single command:
(gdb) thread apply all backtrace

Thread 22 (Thread 0x7fffc8dff640 (LWP 1028872) "tloop-thread-15"):
#0  0x00007ffff7c64c2e in epoll_wait (epfd=8, events=0x2ca3880, maxevents=1024, timeout=-1) at ../sysdeps/unix/sysv/linux/epoll_wait.c:30
#1  0x000000000166e01c in Java_sun_nio_ch_EPoll_wait ()
#2  0x00000000011bfece in sun.nio.ch.EPoll::wait(int, long, int, int) () at com/oracle/svm/core/stack/JavaFrameAnchors.java:42
#3  0x00000000011c08d2 in sun.nio.ch.EPollSelectorImpl::doSelect(java.util.function.Consumer *, long) () at sun/nio/ch/EPollSelectorImpl.java:120
#4  0x00000000011d8977 in sun.nio.ch.SelectorImpl::lockAndDoSelect(java.util.function.Consumer *, long) () at sun/nio/ch/SelectorImpl.java:124
#5  0x0000000000705720 in sun.nio.ch.SelectorImpl::select () at sun/nio/ch/SelectorImpl.java:141
#6  io.netty.channel.nio.SelectedSelectionKeySetSelector::select(void) () at io/netty/channel/nio/SelectedSelectionKeySetSelector.java:68
#7  0x0000000000703c2e in io.netty.channel.nio.NioEventLoop::select(long) () at io/netty/channel/nio/NioEventLoop.java:813
#8  0x0000000000701a5f in io.netty.channel.nio.NioEventLoop::run(void) () at io/netty/channel/nio/NioEventLoop.java:460
#9  0x00000000008496df in io.netty.util.concurrent.SingleThreadEventExecutor$4::run(void) () at io/netty/util/concurrent/SingleThreadEventExecutor.java:986
#10 0x0000000000860762 in io.netty.util.internal.ThreadExecutorMap$2::run(void) () at io/netty/util/internal/ThreadExecutorMap.java:74
#11 0x0000000000840da4 in io.netty.util.concurrent.FastThreadLocalRunnable::run(void) () at io/netty/util/concurrent/FastThreadLocalRunnable.java:30
#12 0x0000000000b7dd04 in java.lang.Thread::run(void) () at java/lang/Thread.java:829
#13 0x0000000000547dcc in com.oracle.svm.core.thread.JavaThreads::threadStartRoutine(org.graalvm.nativeimage.ObjectHandle *) () at com/oracle/svm/core/thread/JavaThreads.java:597
#14 0x00000000004e15b1 in com.oracle.svm.core.posix.thread.PosixJavaThreads::pthreadStartRoutine(com.oracle.svm.core.thread.JavaThreads$ThreadStartData *) () at com/oracle/svm/core/posix/thread/PosixJavaThreads.java:194
#15 0x0000000000480984 in com.oracle.svm.core.code.IsolateEnterStub::PosixJavaThreads_pthreadStartRoutine_e1f4a8c0039f8337338252cd8734f63a79b5e3df(com.oracle.svm.core.thread.JavaThreads$ThreadStartData *) () at com/oracle/svm/core/posix/thread/PosixJavaThreads.java:182
#16 0x00007ffff7be0b1a in start_thread (arg=<optimized out>) at pthread_create.c:443
#17 0x00007ffff7c65650 in clone3 () at ../sysdeps/unix/sysv/linux/x86_64/clone3.S:81

Thread 21 (Thread 0x7fffc97fa640 (LWP 1028871) "tloop-thread-14"):
#0  0x00007ffff7c64c2e in epoll_wait (epfd=53, events=0x2cd0970, maxevents=1024, timeout=-1) at ../sysdeps/unix/sysv/linux/epoll_wait.c:30
#1  0x000000000166e01c in Java_sun_nio_ch_EPoll_wait ()
#2  0x00000000011bfece in sun.nio.ch.EPoll::wait(int, long, int, int) () at com/oracle/svm/core/stack/JavaFrameAnchors.java:42
#3  0x00000000011c08d2 in sun.nio.ch.EPollSelectorImpl::doSelect(java.util.function.Consumer *, long) () at sun/nio/ch/EPollSelectorImpl.java:120
#4  0x00000000011d8977 in sun.nio.ch.SelectorImpl::lockAndDoSelect(java.util.function.Consumer *, long) () at sun/nio/ch/SelectorImpl.java:124
#5  0x0000000000705720 in sun.nio.ch.SelectorImpl::select () at sun/nio/ch/SelectorImpl.java:141
#6  io.netty.channel.nio.SelectedSelectionKeySetSelector::select(void) () at io/netty/channel/nio/SelectedSelectionKeySetSelector.java:68
#7  0x0000000000703c2e in io.netty.channel.nio.NioEventLoop::select(long) () at io/netty/channel/nio/NioEventLoop.java:813
#8  0x0000000000701a5f in io.netty.channel.nio.NioEventLoop::run(void) () at io/netty/channel/nio/NioEventLoop.java:460
#9  0x00000000008496df in io.netty.util.concurrent.SingleThreadEventExecutor$4::run(void) () at io/netty/util/concurrent/SingleThreadEventExecutor.java:986
#10 0x0000000000860762 in io.netty.util.internal.ThreadExecutorMap$2::run(void) () at io/netty/util/internal/ThreadExecutorMap.java:74
#11 0x0000000000840da4 in io.netty.util.concurrent.FastThreadLocalRunnable::run(void) () at io/netty/util/concurrent/FastThreadLocalRunnable.java:30
#12 0x0000000000b7dd04 in java.lang.Thread::run(void) () at java/lang/Thread.java:829
#13 0x0000000000547dcc in com.oracle.svm.core.thread.JavaThreads::threadStartRoutine(org.graalvm.nativeimage.ObjectHandle *) () at com/oracle/svm/core/thread/JavaThreads.java:597
#14 0x00000000004e15b1 in com.oracle.svm.core.posix.thread.PosixJavaThreads::pthreadStartRoutine(com.oracle.svm.core.thread.JavaThreads$ThreadStartData *) () at com/oracle/svm/core/posix/thread/PosixJavaThreads.java:194
#15 0x0000000000480984 in com.oracle.svm.core.code.IsolateEnterStub::PosixJavaThreads_pthreadStartRoutine_e1f4a8c0039f8337338252cd8734f63a79b5e3df(com.oracle.svm.core.thread.JavaThreads$ThreadStartData *) () at com/oracle/svm/core/posix/thread/PosixJavaThreads.java:182
#16 0x00007ffff7be0b1a in start_thread (arg=<optimized out>) at pthread_create.c:443
#17 0x00007ffff7c65650 in clone3 () at ../sysdeps/unix/sysv/linux/x86_64/clone3.S:81

Thread 20 (Thread 0x7fffc9ffb640 (LWP 1028870) "tloop-thread-13"):
...
Note, however, that despite being able to get a backtrace we can still not list the source code at point with the list command.
(gdb) list
164    in com/oracle/svm/core/UnmanagedMemoryUtil.java
This is because gdb is not aware of the location of the source files.
We are running the executable outside the target directory.
To fix this we can either rerun gdb from the target directory or,
run directory target/debugging-native-1.0.0-SNAPSHOT-native-image-source-jar/sources e.g.:
(gdb) directory target/debugging-native-1.0.0-SNAPSHOT-native-image-source-jar/sources
Source directories searched: /data/target/debugging-native-1.0.0-SNAPSHOT-native-image-source-jar/sources:$cdir:$cwd
(gdb) list
164        	UnsignedWord offset = size;
165        	while (offset.aboveOrEqual(32)) {
166            	offset = offset.subtract(32);
167            	Pointer src = from.add(offset);
168            	Pointer dst = to.add(offset);
169            	long l24 = src.readLong(24);
170            	long l16 = src.readLong(16);
171            	long l8 = src.readLong(8);
172            	long l0 = src.readLong(0);
173            	dst.writeLong(24, l24);
We can now examine line 169 and get a first hint of what might be wrong
(in this case we see that it fails at the first read from src which contains the address 0x0000),
or walk up the stack using gdb’s up command to see what part of our code led to this situation.
For more information about using gdb to debug native executables, see the
GraalVM Debug Info Feature guide.
Frequently Asked Questions
Why is the process of generating a native executable slow?
Native executable generation is a multi-step process. The analysis and compile steps are the most expensive of all and hence the ones that dominate the time spent generating the native executable.
In the analysis phase, a static points-to analysis starts from the main method of the program to find out what is reachable. As new classes are discovered, some of them will be initialized during this process depending on the configuration. In the next step, the heap is snapshotted and checks are made to see which types need to be available at runtime. The initialization and heap snapshotting can cause new types to be discovered, in which case the process is repeated. The process stops when a fixed point is reached, that is when the reachable program grows no more.
The compilation step is pretty straightforward, it simply compiles all the reachable code.
The time spent in analysis and compilation phases depends on how big the application is. The bigger the application, the longer it takes to compile it. However, there are certain features that can have an exponential effect. For example, when registering types and methods for reflection access, the analysis can’t easily see what’s behind those types or methods, so it has to do more work to complete the analysis step.
I get a warning about using experimental options, what can I do?
Starting with Mandrel 23.1 and GraalVM for JDK 21, the native executable generation process will warn about the use of experimental options with a message like this:
Warning: The option '-H:ReflectionConfigurationResources=META-INF/native-image/io.micrometer/micrometer-core/reflect-config.json' is experimental and must be enabled via '-H:+UnlockExperimentalVMOptions' in the future.If the mentioned option is added by a third party library like in the example above, you should consider opening an issue in the library’s repository to ask for the option to be removed.
If the option is added by your application, you should consider either removing it (if it’s not necessary) or wrapping it between -H:+UnlockExperimentalVMOptions and -H:-UnlockExperimentalVMOptions.
I get a AnalysisError\$ParsingError when building a native executable due to an UnresolvedElementException, what can I do?
When building a native executable Quarkus requires all classes being referenced by the code, no matter if they are build-time or run-time initialized, to be present in the classpath.
This way it ensures that there will be no crashes at runtime due to potential NoClassDefFoundError exceptions.
To achieve this it makes use of GraalVM’s --link-at-build-time parameter:
--link-at-build-time  require types to be fully defined at image build-time. If used
                      without args, all classes in scope of the option are required to
                      be fully defined.
This, however, may result in an AnalysisError\$ParsingError due to an UnresolvedElementException at build time.
This is often caused because the application references a class from an optional dependency.
If you have access to the source code responsible for the reference to the missing dependency and can alter it, you should consider one of the following:
-
Remove the reference if it’s not actually necessary.
-
Move the affected code in a sub-module and make the dependency non-optional (as is the best practice).
-
Make the dependency non-optional.
In the unfortunate case where the reference causing the issue is made by a 3rd party library, that you cannot modify, you should consider one of the following:
-
Use a class/method substitution to remove the said reference.
-
Add the optional dependency as a non-optional dependency of your project.
Note that although option (1) is the best choice performance wise, as it minimizes the applications footprint,it might not be trivial to implement. To make matters worse, it’s also not easy to maintain as it is tightly coupled to the 3rd party library implementation. Option (2) is a straight forward alternative to work around the issue, but comes at the cost of including possibly never invoked code in the resulting native executable.
I get an OutOfMemoryError (OOME) building native executables, what can I do?
Building native executables is not only time consuming, but it also takes a fair amount of memory.
For example, building a sample native Quarkus Jakarta Persistence application such as the Hibernate ORM quickstart,
may use 6GB to 8GB resident set size in memory.
A big chunk of this memory is Java heap,
but extra memory is required for other aspects of the JVM that runs the native building process.
It is still possible to build such applications in environments that have total memory close to the limits,
but to do that it is necessary to shrink the maximum heap size of the GraalVM native image process.
To do that, set a maximum heap size using the quarkus.native.native-image-xmx property.
For example, we can instruct GraalVM to use 5GB of maximum heap size by passing in
-Dquarkus.native.native-image-xmx=5g in the command line.
Building native executables this way might have the side effect of requiring more time to complete. This is due to garbage collection having to work harder for native image generation to have free space to do its job.
Note that typical applications are likely bigger than quickstarts, so the memory requirements will also likely be higher.
Why is runtime performance of a native executable inferior compared to JVM mode?
As with most things in life there are some trade-offs involved when choosing native compilation over JVM mode. So depending on the application the runtime performance of a native application might be slower compared to JVM mode, though that’s not always the case.
JVM execution of an application includes runtime optimization of the code that profits from profile information built up during execution. That includes the opportunities to inline a lot more of the code, locate hot code on direct paths (i.e. ensure better instruction cache locality) and cut out a lot of the code on cold paths (on the JVM a lot of code does not get compiled until something tries to execute it — it is replaced with a trap that causes deoptimization and recompilation). Removal of cold paths provides many more optimization opportunities than are available for ahead of time compilation because it significantly reduces the branch complexity and combinatorial logic of the smaller amount of hot code that is compiled.
By contrast, native executable compilation has to cater for all possible execution paths when it compiles code offline since it does not know which are the hot or cold paths and cannot use the trick of planting a trap and recompiling if it is hit. For the same reason it cannot load the dice to ensure that code cache conflicts are minimized by co-locating hot paths adjacent. Native executable generation is able to remove some code because of the closed world hypothesis but that is often not enough to make up for all the benefits that profiling and runtime deopt & recompile provides to the JVM JIT compiler.
Note, however, that there is a price you pay for that potentially higher JVM speed, and that price is in increased resource usage (both CPU and memory) and startup time because:
-
it takes some time before the JIT kicks in and fully optimizes the code.
-
the JIT compiler consumes resources that could be utilized by the application.
-
the JVM has to retain a lot more metadata and compiler/profiler data to support the better optimizations that it can offer.
The reason for 1) is that code needs to be run interpreted for some time and, possibly, to be compiled several times before all potential optimizations are realized to ensure that:
-
it’s worth compiling that code path, i.e. it’s being executed enough times, and that
-
we have enough profiling data to perform meaningful optimizations.
An implication of 1) is that for small, short-lived applications a native executable may well be a better bet. Although the compiled code is not as well optimized it is available straight away.
The reason for 2) is that the JVM is essentially running the compiler at runtime in parallel with the application itself. In the case of native executables the compiler is run ahead of time removing the need to run the compiler in parallel with the application.
There are several reasons for 3). The JVM does not have a closed world assumption. So, it has to be able to recompile code if loading of new classes implies that it needs to revise optimistic assumptions made at compile time. For example, if an interface has only one implementation it can make a call jump directly to that code. However, in the case where a second implementation class is loaded the call site needs to be patched to test the type of the receiver instance and jump to the code that belongs to its class. Supporting optimizations like this one requires keeping track of a lot more details of the class base than a native executable, including recording the full class and interface hierarchy, details of which methods override other methods, all method bytecode etc. In a native executable most of the details of class structure and bytecode can be ignored at run time.
The JVM also has to cope with changes to the class base or execution profiles that result in a thread going down a previously cold path. At that point the JVM has to jump out of the compiled code into the interpreter and recompile the code to cater for a new execution profile that includes the previously cold path. That requires keeping runtime info that allow a compiled stack frame to be replaced with one or more interpreter frames. It also requires runtime extensible profile counters to be allocated and updated to track what has or has not been executed.
Why are native executables “big”?
This can be attributed to a number of different reasons:
-
Native executables include not only the application code but also, library code, and JDK code. As a result a more fair comparison would be to compare the native executable’s size with the size of the application, plus the size of the libraries it uses, plus the size of the JDK. Especially the JDK part is not negligible even in simple applications like HelloWorld. To get a glance on what is being pulled in the image one can use
-H:+PrintUniversewhen building the native executable. -
Some features are always included in a native executable even though they might never be actually used at run time. An example of such a feature is garbage collection. At compile time we can’t be sure whether an application will need to run garbage collection at run time, so garbage collection is always included in native executables increasing their size even if not necessary. Native executable generation relies on static code analysis to identify which code paths are reachable, and static code analysis can be imprecise leading to more code getting into the image than what’s actually needed.
There is a GraalVM upstream issue with some interesting discussions about that topic.
What version of Mandrel was used to generate a binary?
One can see which Mandrel version was used to generate a binary by inspecting the binary as follows:
$ strings target/debugging-native-1.0.0-SNAPSHOT-runner | \
  grep -e 'com.oracle.svm.core.VM=' -e 'com.oracle.svm.core.VM.Java.Version' -F
com.oracle.svm.core.VM.Java.Version=21.0.5
com.oracle.svm.core.VM=Mandrel-23.1.5.0-Final
How do I enable GC logging in native executables?
See Native Memory Management GC Logging section for details.
Can I get a thread dump of a native executable?
Yes, Quarkus sets up a signal handler for the SIGQUIT signal (or SIGBREAK on windows) that will result in a thread
dump being printed when receiving the SIGQUIT/SIGBREAK signal.
You may use kill -SIGQUIT <pid> to trigger a thread dump.
|
Quarkus uses its own signal handler, to use GraalVM’s default signal handler instead you will need to:
1. Add |
Can I get a heap dump of a native executable? e.g. if it runs out of memory
Starting with GraalVM 22.2.0 it is possible to create heap dumps upon request,
e.g. kill -SIGUSR1 <pid>.
Support for dumping the heap dump upon an out of memory error will follow up.
Can I build and run this examples outside a container in Linux?
Yes you can.
In fact, debugging native executables on a Linux bare metal box offers the best possible experience.
In this kind of environments, root access is not needed except to install packages required to run some debug steps,
or to enable perf to gather events at the kernel.
These are the packages you’ll need on your Linux environment to run through the different debugging sections:
# dnf (rpm-based)
sudo dnf install binutils gdb perf perl-open
# Debian-based distributions:
sudo apt install binutils gdb perf
Generating flame graphs is slow, or produces errors, what can I do?
There are multiple ways in which a native executable produced by Mandrel can be profiled.
All the methods require you to pass in the -H:-DeleteLocalSymbols option.
The method shown in this reference guide generates a binary with DWARF debug information,
runs it via perf record and then uses perf script and flame graph tooling to generate the flamegraphs.
However, the perf script post-processing step done on this binary can appear to be slow or can show some DWARF errors.
An alternative method to generate flame graphs is to pass in -H:+PreserveFramePointer when generating the native executable instead of generating the DWARF debug information.
It instructs the binary to use an extra register for the frame pointer.
This enables perf to do stack walking to profile the runtime behaviour.
To generate the native executable using these flags, do the following:
./mvnw package -DskipTests -Dnative
    -Dquarkus.native.additional-build-args=-H:+PreserveFramePointer,-H:-DeleteLocalSymbols
To get runtime profiling information out of the native executable, simply do:
perf record -F 1009 -g -a ./target/debugging-native-1.0.0-SNAPSHOT-runnerThe recommended method for generating runtime profiling information is using the debug information rather than generating a binary that preserves the frame pointer. This is because adding debug information to the native executable build process has no negative runtime performance whereas preserving the frame pointer does.
DWARF debug info is generated in a separate file and can even be omitted in the default deployment and only be transferred and used on demand,
for profiling or debugging purposes.
Furthermore, the presence of debug info enables perf to show us the relevant source code lines as well,
hence it does not bloat the native executable itself.
To do that, simply call perf report with an extra parameter to show source code lines:
perf report --stdio -F+srcline
...
83.69%     0.00%  GreetingResource.java:20 ...
...
83.69%     0.00%  AbstractStringBuilder.java:1025 ...
...
83.69%     0.00%  ArraycopySnippets.java:95 ...
The performance penalty of preserving the frame pointer is due to using the extra register for stack walking,
particularly in x86_64 compared to aarch64 where there are fewer registers available.
Using this extra register reduces the number of registers that are available for other work,
which can lead to performance penalties.
I think I’ve found a bug in native-image, how can I debug it with the IDE?
Although it is possible to remote debug processes within containers, it might be easier to step-by-step debug native-image by installing Mandrel locally and adding it to the path of the shell process.
Native executable generation is the result of two Java processes that are executed sequentially. The first process is very short and its main job is to set things up for the second process. The second process is the one that takes care of most of the work. The steps to debug one process or the other vary slightly.
Let’s discuss first how to debug the second process,
which is the one you most likely to want to debug.
The starting point for the second process is the com.oracle.svm.hosted.NativeImageGeneratorRunner class.
To debug this process, simply add --debug-attach=*:8000 as an additional build time argument:
./mvnw package -DskipTests -Dnative \
    -Dquarkus.native.additional-build-args=--debug-attach=*:8000
The starting point for the first process is the com.oracle.svm.driver.NativeImages class.
In GraalVM CE distributions, this first process is a binary, so debugging it in the traditional way with a Java IDE is not possible.
However, Mandrel distributions (or locally built GraalVM CE instances) keep this as a normal Java process,
so you can remote debug this process by adding the --vm.agentlib:jdwp=transport=dt_socket,server=y,suspend=y,address=*:8000 as an additional build argument, e.g.
$ ./mvnw package -DskipTests -Dnative \
    -Dquarkus.native.additional-build-args=--vm.agentlib:jdwp=transport=dt_socket\\,server=y\\,suspend=y\\,address=*:8000
Can I use JFR/JMC to debug or profile native binaries?
Java Flight Recorder (JFR) and JDK Mission Control (JMC) can be used to profile native binaries since GraalVM CE 21.2.0. However, JFR in GraalVM is currently limited in capabilities compared to HotSpot. The custom event API is fully supported, but some VM level features are unavailable. More events and JFR features will continue to be added in later releases. The following table outlines Native Image JFR support and limitations by version.
| GraalVM Version | Supports | Limitations |
|---|---|---|
GraalVM CE 21.3 and Mandrel 21.3 |
|
|
GraalVM CE 22.3 and Mandrel 22.3 |
|
|
GraalVM CE for JDK 17/20 and Mandrel 23.0 |
|
|
GraalVM CE for JDK 23 and Mandrel 24.1 |
|
|
To add JFR support to your Quarkus executable, add the application property: -Dquarkus.native.monitoring=jfr.
E.g.
./mvnw package -DskipTests -Dnative -Dquarkus.native.container-build=true \
    -Dquarkus.native.builder-image=quay.io/quarkus/ubi9-quarkus-mandrel-builder-image:jdk-21 \
    -Dquarkus.native.monitoring=jfr
Once the image is compiled, enable and start JFR via runtime flags: -XX:+FlightRecorder and -XX:StartFlightRecording. For example:
./target/debugging-native-1.0.0-SNAPSHOT-runner \
    -XX:+FlightRecorder \
    -XX:StartFlightRecording="filename=recording.jfr"
For more information about using JFR, see the GraalVM JDK Flight Recorder (JFR) with Native Image guide.
How can we troubleshoot performance problems only reproducible in production?
In this situation, switching to JVM mode would be the best thing to try first.
If the performance issues continue after switching to JVM mode,
you can use more established and mature tooling to figure out the root cause.
If the performance issue is limited to native mode only,
you might not be able to use perf,
so JFR is the only way to gather any information in this situation.
As JFR support for native expands,
the ability to detect root causes of performance issues directly in production will improve.
What information helps most debug issues that happen either at build-time or run-time?
To fix classpath, class initialization or forbidden API errors at build time it’s best to use build time reports to understand the closed world universe. A complete picture of the universe, along with the relationships between the different classes and methods will help uncover and fix most of the issues.
To fix runtime native specific errors,
it’s best to have debug info builds of the native executables around,
so that gdb can be hooked up quickly to debug the issue.
If you also add local symbols to the debug info builds,
you will obtain precise profiling information as well.
Build stalled for minutes, barely using any CPU
It might so happen that the build gets stalled and even ends up with:
Image generator watchdog detected no activity.One of the possible explanations could be a lack of entropy, e.g. on an entropy constrained VM, if such a source is needed as it is the case with Bouncycastle at build time.
One can check the available entropy on a Linux system with:
$ cat /proc/sys/kernel/random/entropy_availIf the amount is not in hundreds, it could be a problem. A possible workaround is to compromise, acceptable for testing, and set:
export JAVA_OPTS=-Djava.security.egd=/dev/urandomThe proper solution is to increase the entropy available for the system. That is specific for each OS vendor and virtualization solution though.
Work around missing CPU features
When building on recent machines and running your native executable on older machines, you may see the following failure when starting the application:
The current machine does not support all of the following CPU features that are required by the image: [CX8, CMOV, FXSR, MMX, SSE, SSE2, SSE3, SSSE3, SSE4_1, SSE4_2, POPCNT, LZCNT, AVX, AVX2, BMI1, BMI2, FMA].
Please rebuild the executable with an appropriate setting of the -march option.
This error message means that the native compilation used more advanced instruction sets, not supported by the CPU running the application.
To work around that issue, add the following line to the application.properties:
quarkus.native.march=compatibilityThen, rebuild your native executable. This setting forces the native compilation to use an older instruction set, increasing the chance of compatibility.
To explicitly define the target architecture run native-image -march=list to get the supported configurations and then set -march to one of them, e.g., quarkus.native.additional-build-args=-march=x86-64-v4.
If you are targeting an AMD64 host, -march=x86-64-v2 would work in most cases.
The march parameter is only available on GraalVM 23+.
|