Reactive CRUD Performance: A Case Study
By

We were approached for comment about the relative performance of Quarkus for a reactive CRUD workload. This is a good case study into performance test design and some of the considerations required and hurdles that need to be overcome. What methodology can we derive for ensuring that the test we are performing is indeed the test that we are expecting?
"Why is Quarkus 600x times slower than {INSERT_FRAMEWORK_HERE}?!?"
A recent report of bad result from Quarkus warranted some further investigation. On the face of it the results looked bad, really bad, for Quarkus.
tl;dr
By correcting implementation errors in a benchmark test, and carefully designing the test environment to ensure that only the application is being stressed, Quarkus goes from handling 1.75 req/sec to nearly 26,000 req/sec. Each request queried and wrote to a MySQL database, using the same load driver and hardware.
Test architecture
The test that was shared with us is a simple load test that updates a database via REST invocations;
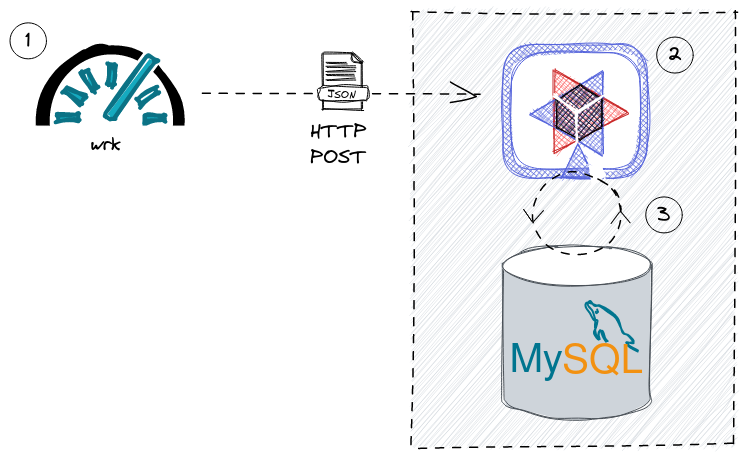
-
A load generator creates a continuous stream of HTTP POST requests to a REST api. In this case wrk
-
A Quarkus application process the request via RESTEasy Reactive
-
The Quarkus application queries and updates a MySQL database instance via Hibernate Reactive
The source code for the test can be found here: https://github.com/thiagohora/tutorials/tree/fix_jmeter_test
To learn more about creating Reactive Applications with Quarkus, please read the Getting Started With Reactive guide
Initial Results 
Initial results for Quarkus were not promising;
$ wrk -t2 -c10 -d1m -s ./post_zipcode.lua --timeout 2m -H 'Host: localhost' http://localhost:8080
Running 1m test @ http://localhost:8080
  2 threads and 10 connections
  Thread Stats   Avg      Stdev     Max   +/- Stdev
    Latency     6.26s    10.29s   30.03s    77.78%
    Req/Sec    72.55     97.66   270.00     81.82%
  105 requests in 1.00m, 20.69KB read
  Socket errors: connect 0, read 10, write 0, timeout 0
  Non-2xx or 3xx responses: 10
Requests/sec:      1.75
Transfer/sec:     352.77B
That was 105 requests in 60 seconds, with 10 errors. Only 95 requests had been successfully sent in 60 seconds, or 1.75 req/sec
Running the comparison test on my machine;
$ wrk -t2 -c10 -d1m -s ./post_zipcode.lua --timeout 2m -H 'Host: localhost' http://localhost:8080
Running 1m test @ http://localhost:8080
  2 threads and 10 connections
  Thread Stats   Avg      Stdev     Max   +/- Stdev
    Latency    35.78ms   43.69ms 568.52ms   92.67%
    Req/Sec   171.93    113.83   777.00     80.61%
  20228 requests in 1.00m, 3.70MB read
Requests/sec:    336.86
Transfer/sec:     63.04KB
Overall, the request rate that Quarkus could support was only 1.75 req/sec!! Ok, so it wasn’t 600 times slower, but it was 192 times slower on my machine.
but… something was not correct, Quarkus was displaying the following exception in the service logs;
2022-06-17 15:20:44,507 ERROR [org.hib.rea.errors] (vert.x-eventloop-thread-45) HR000057: Failed to execute statement [select zipcode0_.zip as zip1_0_0_, zipcode0_.city as city2_0_0_, zipcode0_.county as county3_0_0_, zipcode0_.state as state4_0_0_, zipcode0_.timezone as timezone5_0_0_, zipcode0_.type as type6_0_0_ from ZipCode zipcode0_ where zipcode0_.zip=?]: could not load an entity: [com.baeldung.quarkus_project.ZipCode#08231]: java.util.concurrent.CompletionException: io.vertx.core.impl.NoStackTraceThrowable: Timeout
	at java.base/java.util.concurrent.CompletableFuture.encodeThrowable(CompletableFuture.java:332)
	at java.base/java.util.concurrent.CompletableFuture.completeThrowable(CompletableFuture.java:347)
	at java.base/java.util.concurrent.CompletableFuture$UniApply.tryFire(CompletableFuture.java:636)
	at java.base/java.util.concurrent.CompletableFuture.postComplete(CompletableFuture.java:510)
	at java.base/java.util.concurrent.CompletableFuture.completeExceptionally(CompletableFuture.java:2162)
	at io.vertx.core.Future.lambda$toCompletionStage$2(Future.java:362)
	...
	at io.netty.channel.nio.NioEventLoop.run(NioEventLoop.java:503)
	at io.netty.util.concurrent.SingleThreadEventExecutor$4.run(SingleThreadEventExecutor.java:986)
	at io.netty.util.internal.ThreadExecutorMap$2.run(ThreadExecutorMap.java:74)
	at io.netty.util.concurrent.FastThreadLocalRunnable.run(FastThreadLocalRunnable.java:30)
	at java.base/java.lang.Thread.run(Thread.java:833)
Caused by: io.vertx.core.impl.NoStackTraceThrowable: Timeout
An initial investigation showed that the number of open MySQL connections during the test was very high: 96 open connections
mysql> show status like '%onn%';
+-----------------------------------------------+---------------------+
| Variable_name                                 | Value               |
+-----------------------------------------------+---------------------+
...
| Max_used_connections                          | 96                  |
| Max_used_connections_time                     | 2022-06-17 14:20:07 |
...
| Threads_connected                             | 96                  |
+-----------------------------------------------+---------------------+
16 rows in set (0.01 sec)
And checking the number of inserts the application had managed to perform within 1minutes;
mysql> select count(*) from ZipCode;
+----------+
| count(*) |
+----------+
|       95 |
+----------+
1 row in set (0.00 sec)
There was obviously something wrong with the database connections! Each connection was committing only a single value to the database and no more progress was being made. The number of entries in the database tallied exactly with the number of successful HTTP requests.
Reviewing the CPU time for the Quarkus process confirmed that no further work was being done after the initial 95 commits to the database, the application was deadlocked;
$ pidstat -p 869871 1
Linux 5.17.11-200.fc35.x86_64 (localhost.localdomain) 	17/06/22 	_x86_64_	(32 CPU)

15:32:41      UID       PID    %usr %system  %guest   %wait    %CPU   CPU  Command
15:32:42     1000    869871    0.00    0.00    0.00    0.00    0.00    22  java
15:32:43     1000    869871    0.00    0.00    0.00    0.00    0.00    22  java
15:32:44     1000    869871    0.00    0.00    0.00    0.00    0.00    22  java
15:32:45     1000    869871    0.00    0.00    0.00    0.00    0.00    22  java
15:32:46 1000 869871 0.00 0.00 0.00 0.00 0.00 22 java|
Is the application behaving as expected? If the application is erroring, the results are not valid. Before continuing, investigate why the errors are occurring and fix the application. |
Initial inspection of code
A quick review of the code revealed the deadlocking issue;
@POST
@Transactional
public Uni<ZipCode> create(ZipCode zipCode) {
    return getById(zipCode.getZip())
        .onItem()
        .ifNull()
        .switchTo(createZipCode(zipCode))
        .onFailure(PersistenceException.class)
        .recoverWithUni(() -> getById(zipCode.getZip()));
}
Ah Ha! the endpoint is annotated with @Transactional. The application is using Hibernate Reactive, so instead we need to use the @ReactiveTransactional annotation. For further details, please read the Simplified Hibernate Reactive with Panache guide. This can be confusing, but conversations have started about how to clarify the different requirements and warn users if there is an issue.
Quarkus Application Fixed 
@POST
@ReactiveTransactional
public Uni<ZipCode> create(ZipCode zipCode) {
    return getById(zipCode.getZip())
        .onItem()
        .ifNull()
        .switchTo(createZipCode(zipCode))
        .onFailure(PersistenceException.class)
        .recoverWithUni(() -> getById(zipCode.getZip()));
}
Let’s try again:
$ wrk -t2 -c10 -d1m -s ./post_zipcode.lua --timeout 2m -H 'Host: localhost' http://localhost:8080
Running 1m test @ http://localhost:8080
  2 threads and 10 connections
  Thread Stats   Avg      Stdev     Max   +/- Stdev
    Latency    30.06ms   33.67ms 351.38ms   87.66%
    Req/Sec   197.60    145.88     1.14k    82.24%
  23427 requests in 1.00m, 4.60MB read
  Socket errors: connect 0, read 3, write 0, timeout 0
  Non-2xx or 3xx responses: 3
Requests/sec:    390.21
Transfer/sec:     78.40KB
390.21 req/sec!! that’s much better!!
With the test fixed, we can see a lot more data in the database table;
mysql> select count(*) from ZipCode;
+----------+
| count(*) |
+----------+
|    10362 |
+----------+
1 row in set (0.00 sec)| The test has been designed to query the database if a ZipCode already exists, before attempting to insert a new ZipCode. There are a finite number of ZipCodes, so as the test progresses, the number of ZipCode entries will tend towards the maximum number of ZipCodes. The workload progresses from being write heavy to read heavy. |
Same results
but… my hard disk on my machine was making a lot of noise during the test! The Quarkus result of 390.21 req/sec is suspiciously similar to the comparison baseline of 336.86 req/sec, and…
$ pidstat -p 873146 1
...
15:46:29      UID       PID    %usr %system  %guest   %wait    %CPU   CPU  Command
15:46:30     1000    873146   59.00    6.00    0.00    0.00   65.00    12  java
15:46:31     1000    873146   57.00    4.00    0.00    0.00   61.00    12  java
15:46:32     1000    873146   50.00    3.00    0.00    0.00   53.00    12  java
15:46:33     1000    873146   27.00    5.00    0.00    0.00   32.00    12  java
15:46:34     1000    873146   32.00    3.00    0.00    0.00   35.00    12  java
15:46:35     1000    873146   50.00    4.00    0.00    0.00   54.00    12  java
15:46:36     1000    873146   27.00    3.00    0.00    0.00   30.00    12  java
15:46:37     1000    873146   27.00    4.00    0.00    0.00   31.00    12  java
15:46:38     1000    873146   39.00    4.00    0.00    0.00   43.00    12  java
15:46:39     1000    873146   48.00    2.00    0.00    0.00   50.00    12  java
15:46:40     1000    873146   40.00    2.00    0.00    0.00   42.00    12  java
15:46:41     1000    873146   28.00    5.00    0.00    0.00   33.00    12  java
15:46:42     1000    873146   23.00    4.00    0.00    0.00   27.00    12  java
The application is using less than 0.5 cores on a 32 core machine… hmm!
|
Is the application the bottleneck? If a system component is the performance bottleneck (i.e. not the application under test), we are not actually stress testing the application. |
Move to a faster Disk
Let’s move the database files to a faster disk;
$ docker run -d --rm --name mysqldb --network=host -e MYSQL_ROOT_PASSWORD=root -e MYSQL_DATABASE=baeldung -v /home/user/mysqlData:/var/lib/mysql -d mysql:5.7.38 --character-set-server=utf8mb4 --collation-server=utf8mb4_unicode_ciand re-run the test
$ wrk -t2 -c10 -d1m -s ./post_zipcode.lua --timeout 2m -H 'Host: localhost' http://localhost:8080
Running 1m test @ http://localhost:8080
  2 threads and 10 connections
  Thread Stats   Avg      Stdev     Max   +/- Stdev
    Latency     2.97ms   17.85ms 319.79ms   98.44%
    Req/Sec    12.99k     6.45k   18.88k    77.23%
  1538167 requests in 1.00m, 301.75MB read
  Socket errors: connect 0, read 4, write 0, timeout 0
  Non-2xx or 3xx responses: 4
Requests/sec:  25599.85
Transfer/sec:      5.02MB
Sit back, Relax and Profit! 25,599.85 req/sec!
|
Do not stop here! While it is easy to claim we have resolved the issue, for comparisons, we still do not have a controlled environment to run tests! |
System bottleneck still exists
the Quarkus process is now using 4.5 cores…
]$ pidstat -p 884208 1
Linux 5.17.11-200.fc35.x86_64 (localhost.localdomain) 	17/06/22 	_x86_64_	(32 CPU)

16:12:50      UID       PID    %usr %system  %guest   %wait    %CPU   CPU  Command
16:12:51     1000    884208  294.00  175.00    0.00    0.00  469.00    26  java
16:12:52     1000    884208  305.00  173.00    0.00    0.00  478.00    26  java
16:12:53     1000    884208  304.00  173.00    0.00    0.00  477.00    26  java
16:12:54     1000    884208  299.00  169.00    0.00    0.00  468.00    26  java
16:12:55     1000    884208  296.00  173.00    0.00    0.00  469.00    26  java
16:12:56     1000    884208  298.00  171.00    0.00    0.00  469.00    26  java
16:12:57     1000    884208  308.00  175.00    0.00    0.00  483.00    26  java
16:12:58     1000    884208  301.00  177.00    0.00    0.00  478.00    26  java
16:12:59     1000    884208  305.00  166.00    0.00    0.00  471.00    26  java
16:13:00     1000    884208  304.00  169.00    0.00    0.00  473.00    26  java
16:13:01     1000    884208  307.00  172.00    0.00    0.00  479.00    26  java
16:13:02 1000 884208 301.00 174.00 0.00 0.00 475.00 26 javabut… the system is 60% idle
$ vmstat 1
procs -----------memory---------- ---swap-- -----io---- -system-- ------cpu-----
 r  b swpd    free    buff   cache     si   so    bi    bo    in     cs us sy id wa st
14  0 5254976 9665088 590824 4895220    0    0     0     0 50997 715648 25 16 59  0  0
16  0 5254976 9667204 590824 4895220    0    0     0  1372 50995 710429 24 16 60  0  0
15  0 5254976 9666244 590824 4895232    0    0     0     0 51544 707477 24 16 59  0  0
11  0 5254976 9664892 590872 4895160    0    0     0   980 51178 700680 24 16 60  0  0
14  0 5254976 9662968 590880 4895232    0    0     0    12 54800 710039 25 16 59  0  0
We still have a bottleneck outside of the application, most likely within MySQL or we are still I/O bound!
At this point, we have a couple of options, we can either;
A) tune MySQL/IO so that they are no longer the bottleneck
or
B) constrain that application below the maximum, such that the rest of the system is operating within its limits
The easiest option is to simply constrain the application.
|
Choose your scaling methodology We can either scale up or tune the system, or we can scale down the application to below the limits of the system. Choosing to scale up the system, or constrain the application, is a decision dependent on the goals of the testing. |
Constrain application
We will remove the MySQL/System bottleneck by constraining the application to 4 CPU cores, therefore reducing the maximum load the application can drive to the database. We achieve this by running the application in docker;
$ docker build -f ./src/main/docker/Dockerfile.jvm -t quarkus-project:0.1-SNAPSHOT .
...
Successfully built 0cd0d50404ac
Successfully tagged quarkus-project:0.1-SNAPSHOT

$ docker run --network host --cpuset-cpus=0-3 quarkus-project:0.1-SNAPSHOT
and re-running the test;
$ wrk -t2 -c10 -d1m -s ./post_zipcode.lua --timeout 2m -H 'Host: localhost' http://localhost:8080
Running 1m test @ http://localhost:8080
  2 threads and 10 connections
  Thread Stats   Avg      Stdev     Max   +/- Stdev
    Latency     5.36ms   44.30ms 766.89ms   98.94%
    Req/Sec     9.50k     4.45k   15.37k    78.52%
  1121692 requests in 1.00m, 220.06MB read
  Socket errors: connect 0, read 1, write 0, timeout 0
  Non-2xx or 3xx responses: 1
Requests/sec:  18667.87
Transfer/sec:      3.66MB
Ok, so we are not at Max Throughput, but we have removed the system outside of the application as a bottleneck. The bottleneck is NOW the application
|
Create an environment where the comparisons are valid By constraining the application, we are not running at absolute Max Throughput possible, but we have created an environment that allows for comparisons between frameworks. With a constrained application environment, we will not be in the situation where one or more frameworks are sustaining throughput levels that are at the limit of the system. If any application is at the system limit, the results are invalid. |
All network traffic is not equal!
Further investigation showed that Quarkus is not running with TLS enabled between the application and database, so database network traffic is running un-encrypted. Let’s fix that;
quarkus.datasource.reactive.url=${DB_URL:mysql://localhost:3306/baeldung?useSSL=false&tlsVersion=TLSv1.2}
quarkus.datasource.reactive.max-size=95
quarkus.datasource.reactive.mysql.ssl-mode=required
#"don't do this in prod, don't do this @ home, don't do this !"
#required for this test as mysql cert is self-signed
quarkus.datasource.reactive.trust-all=true
and re-run
$ wrk -t2 -c10 -d1m -s ./post_zipcode.lua --timeout 2m -H 'Host: localhost' http://localhost:8080
Running 1m test @ http://localhost:8080
  2 threads and 10 connections
  Thread Stats   Avg      Stdev     Max   +/- Stdev
    Latency     2.44ms   12.94ms 354.67ms   98.17%
    Req/Sec     7.55k     3.55k   11.94k    77.93%
  898541 requests in 1.00m, 176.26MB read
  Socket errors: connect 0, read 2, write 0, timeout 0
  Non-2xx or 3xx responses: 2
Requests/sec:  14955.61
Transfer/sec:      2.93MB
This provided us with a final, comparable throughput result of 14,955.61 req/sec
|
For comparisons, we need to ensure that each framework is performing the same work |

Results
Is Quarkus really 600x times slower than Framework X/Y/Z? Of course not!
On my machine;
-
the initial result was 1.75 req/sec.
-
fixing the application brought that up to 390.21 req/sec
-
fixing some of the system bottlenecks gave us 25,599.85 req/sec
-
constraining the application, so that a fairer comparison with other frameworks can be made resulted in 18,667.87 req/sec
-
and finally, enabling TLS encryption to the database gives a final result of 14,955.61 req/sec
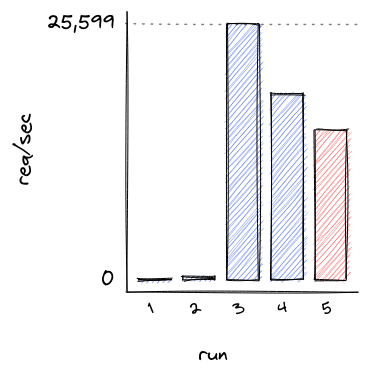
| Run 5 gives us our baseline for comparison, 14,955.61 req/sec |
Summary
Do these results show that Quarkus is quick? Well kinda, they hint at it, but there are still issues with the methodology that need resolving.
However, when faced with a benchmark result, especially one that does not appear to make sense, there are a number of steps you can take to validate the result;
-
Fix the application: Are there errors? Is the test functioning as expected? If there are errors, resolve them
-
Ensure the application is the bottleneck: What are the limiting factors for the test? Is the test CPU, Network I/O, Disk I/O bound?
-
Do not stop evaluating the test when you see a "good" result. For comparisons, you need to ensure that every framework is the limiting factor for performance and not the system.
-
Chose how to constrain the application: either by scaling up the system, or scaling down the application.
-
Validate that all frameworks are doing the same work. For comparisons, are the frameworks performing the same work?
-
Ensure al frameworks are providing the same level of security. Are the semantics the same? e.g. same TLS encoding? same db transaction isolation levels?
| The System Under Test includes the System. Do not automatically assume that your application is the bottleneck |
Notes on Methodology
|
Does this benchmark tell us everything we need to know about how Quarkus behaves under load? Not really! It gives us one data point In order to have a meaningful understanding of behavior under load, the following issues with methodology need to be addressed;
|