Quarkus Native adopts Adaptive GC policy

Starting with Quarkus 2.13.6.Final, the native runtime garbage collection policy switched in order to provide more consistent and predictable runtime performance. This blog post tells the story of this switch.
Sometime in 2022 while carrying out some native runtime performance benchmarking we observed that, in constant load plain text benchmarks, memory consumption would grow continuously until it reached around 500MB and then it would drop. The memory consumption graph would look something like this:
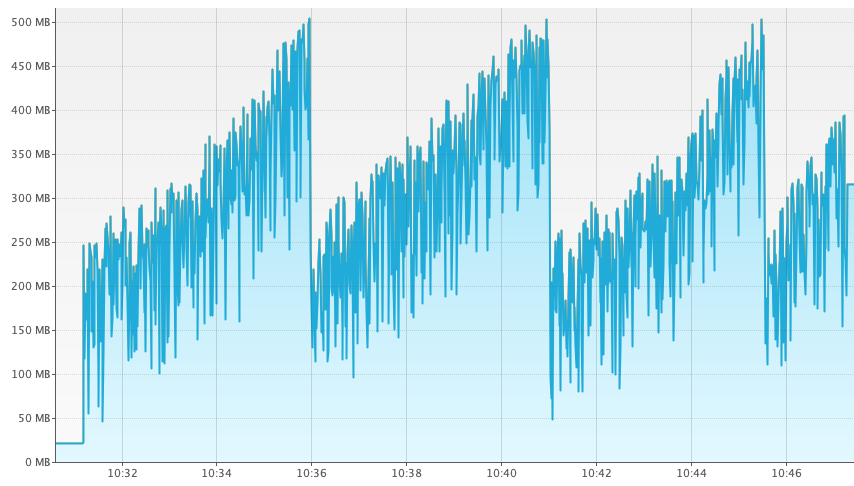
| The graph above was obtained with VisualVM. This feature has only been available in the GraalVM Community Edition starting with version 22.3.0. See here for more details. |
The graph looked suspicious. At a first glance, small garbage collections were happening regularly but those collections were not able to fully collect all the garbage. This uncollected garbage would continue to grow until around the 500MB mark, at which point a full garbage collection would happen and it would clear the growing leak.
The first thing we wondered was, what this ~500MB limit was and where it was coming from. To do that, we enabled GC logging to see if we could get some clues:
$ quarkus-project/target/quarkus-project-1.0.0-SNAPSHOT-runner -XX:+PrintGC -XX:+VerboseGC
2023-01-09 13:29:32,155 INFO  [io.quarkus] (main) quarkus-project 1.0.0-SNAPSHOT native (powered by Quarkus 2.15.2.Final) started in 0.017s. Listening on: http://0.0.0.0:8080
...
[Heap policy parameters:
  YoungGenerationSize: 268435456
      MaximumHeapSize: 27487790640
      MinimumHeapSize: 536870912 <--
     AlignedChunkSize: 1048576
  LargeArrayThreshold: 131072]
We realized that this number is actually 512MB, which is the default minimum heap size GraalVM configures when the maximum heap size is anything above ~3GB of physical memory.
The next question was, why is there a relationship between the minimum heap size and the memory consumption at which a full GC appears to happen? Looking at the output above, on our system the default maximum heap size is 25.6GB. GraalVM defaults the maximum heap size to 80% of the physical memory if no specific configuration is passed, and indeed 25.6GB is 80% of 32GB. It would seem odd to do a full GC when 512MB have been consumed, given that our system has given it a maximum heap size that is far bigger. The answer was found in the GC policy Quarkus was explicitly configuring.
By default GraalVM uses a GC policy called "adaptive", but Quarkus was instead instructing GraalVM to use another GC policy called "by space and time". The full story on why Quarkus was using a different GC policy can be found here, but to summarize, the decision was made in 2018, when "by space and time" appeared to generate less full GCs and offered considerably better throughput.
The "by space and time" GC policy implemented a shouldCollectCompletely method that decided whether to do a complete (full) or incremental (minimal) collection.
The relevant code of the "by space and time" GC policy is the following:
return estimateUsedHeapAtNextIncrementalCollection().aboveThan(getMaximumHeapSize()) // (1)
  || GCImpl.getChunkBytes().aboveThan(getMinimumHeapSize()) && enoughTimeSpentOnIncrementalGCs(); // (2)
One option (1) for doing a full GC would be when it estimates that the used heap will exceed maximum heap size,
but that wasn’t our case.
The other (2) would be if enough minimal collections had happened and the used heap was above the minimum heap size.
This latter option was what was happening here.
At this point we thought, do the assumptions made about the default GC policy still apply in 2022? So, we removed the GC policy configuration tweak, repeated the test and we observed the following memory consumption:
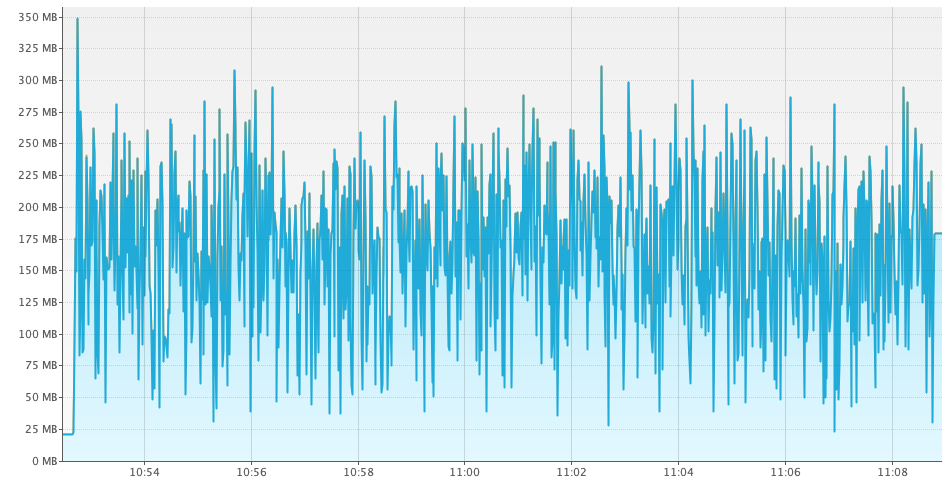
For the same workload the default GC policy, called "adaptive", consumed close to 50% less heap compared to the "by space and time" one. Note, however, that these graphs alone are not enough to make the switch since we could have a situation where "adaptive" is using less memory because the overall throughput is less. So, let’s look at the benchmark that generated the graphs above and see what throughput numbers we obtain. Using Hyperfoil, the "by space and time" policy reported these numbers on our environment:
[hyperfoil@in-vm]$ wrk -t 128 -c 512 -H 'accept: text/plain' -d 16m http://<host>:8080/hello
PHASE        METRIC   THROUGHPUT    REQUESTS  ... TIMEOUTS  ERRORS  BLOCKED   2xx
test         request  93.79k req/s  90036541  ...        0       0      0 ns  90036094
And here are the numbers for the "adaptive" policy:
[hyperfoil@in-vm]$ wrk -t 128 -c 512 -H 'accept: text/plain' -d 16m http://<host>:8080/hello
PHASE        METRIC   THROUGHPUT    REQUESTS  ... TIMEOUTS  ERRORS  BLOCKED   2xx
test         request  93.05k req/s  89329151  ...         0       0     0 ns  89328711
The results were obtained with wrk,
which is known to have issues with latency numbers
(see this blog post for more details),
so we can ignore those in the context of this blog post and focus on throughput numbers.
|
For the same workload, the throughput obtained with the "adaptive" policy is within 1% of the one obtained with the "by space and time" policy. So getting pretty much the same throughput with "adaptive" as with "by space and time" and close to 50% less memory consumption, made it a pretty convincing argument to switch to the "adaptive" GC policy as the default for Quarkus, as it was already the case for other GraalVM.
| The memory consumption benefits do not apply evenly across all heap sizes. Numbers like the ones published in this blog post would apply for maximum heap sizes that are equal or above 3GB, at which stage the default minimum heap size is set to ~512MB unless configured otherwise. For smaller maximum heap sizes, the memory consumption improvements might be smaller or non-existent. |
We often see tests or benchmarks run with no -Xmx configured,
in which case as stated above,
the maximum heap size is set to 80% of the available physical memory and this heap size can easily exceed 3GB on modern hardware.
These users would see better out of the box experience with the "adaptive" GC policy.
So, starting with Quarkus 2.13.6.Final, the GC policy for Quarkus native applications was aligned with GraalVM’s default, called "adaptive". It is still possible to set the GC policy back to "by space and time", should that work better in a specific case. This can be useful to do if you observe a regression with this GC policy change in your own Quarkus application. To do so, pass in:
-Dquarkus.native.additional-build-args=-H:InitialCollectionPolicy=com.oracle.svm.core.genscavenge.CollectionPolicy\$BySpaceAndTime
It is necessary to escape $ sign if passing in via command line.
|
More details on the investigation carried out can be found in the original GitHub issue. As a result of this work, we have also enhanced the Quarkus Native Reference Guide to add a Native Memory Management section. This new section should help Quarkus Native users understand how memory management works and how to get the most out of it.